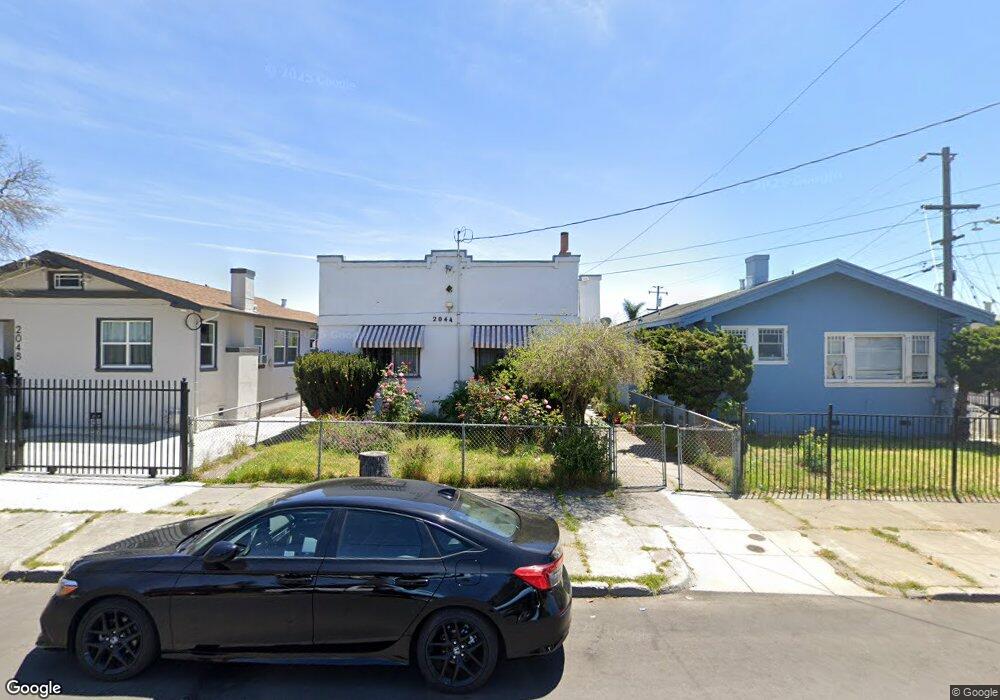
2044 55th Ave Oakland, CA 94621
Seminary NeighborhoodEstimated Value: $475,000 - $642,000
2
Beds
1
Bath
972
Sq Ft
$564/Sq Ft
Est. Value
About This Home
This home is located at 2044 55th Ave, Oakland, CA 94621 and is currently estimated at $548,417, approximately $564 per square foot. 2044 55th Ave is a home located in Alameda County with nearby schools including Greenleaf TK-8, Frick United Academy of Language, and Fremont High School.
Ownership History
Date
Name
Owned For
Owner Type
Purchase Details
Closed on
May 4, 2005
Sold by
Boyd Katherine Anne
Bought by
Ortiz Mario Salinas and Aguila Georgina
Current Estimated Value
Home Financials for this Owner
Home Financials are based on the most recent Mortgage that was taken out on this home.
Original Mortgage
$326,851
Outstanding Balance
$172,389
Interest Rate
6.02%
Mortgage Type
Purchase Money Mortgage
Estimated Equity
$376,028
Purchase Details
Closed on
Mar 30, 2000
Sold by
Perry Ernest C and Perry Janet
Bought by
Boyd Katherine Anne
Home Financials for this Owner
Home Financials are based on the most recent Mortgage that was taken out on this home.
Original Mortgage
$142,500
Interest Rate
8.38%
Purchase Details
Closed on
Jun 22, 1998
Sold by
Perry Ernest C
Bought by
Perry Ernest C and Perry Janet
Create a Home Valuation Report for This Property
The Home Valuation Report is an in-depth analysis detailing your home's value as well as a comparison with similar homes in the area
Home Values in the Area
Average Home Value in this Area
Purchase History
| Date | Buyer | Sale Price | Title Company |
|---|---|---|---|
| Ortiz Mario Salinas | $385,000 | First American Title Co | |
| Boyd Katherine Anne | $150,000 | First American Title Guarant | |
| Perry Ernest C | -- | -- |
Source: Public Records
Mortgage History
| Date | Status | Borrower | Loan Amount |
|---|---|---|---|
| Open | Ortiz Mario Salinas | $326,851 | |
| Previous Owner | Boyd Katherine Anne | $142,500 | |
| Closed | Ortiz Mario Salinas | $25,000 |
Source: Public Records
Tax History Compared to Growth
Tax History
| Year | Tax Paid | Tax Assessment Tax Assessment Total Assessment is a certain percentage of the fair market value that is determined by local assessors to be the total taxable value of land and additions on the property. | Land | Improvement |
|---|---|---|---|---|
| 2025 | $8,391 | $529,604 | $160,981 | $375,623 |
| 2024 | $8,391 | $519,086 | $157,826 | $368,260 |
| 2023 | $8,779 | $515,772 | $154,731 | $361,041 |
| 2022 | $8,535 | $498,661 | $151,698 | $353,963 |
| 2021 | $8,132 | $488,748 | $148,724 | $347,024 |
| 2020 | $8,042 | $490,666 | $147,200 | $343,466 |
| 2019 | $7,722 | $481,048 | $144,314 | $336,734 |
| 2018 | $6,624 | $403,000 | $120,900 | $282,100 |
| 2017 | $5,143 | $305,000 | $91,500 | $213,500 |
| 2016 | $4,465 | $265,000 | $79,500 | $185,500 |
| 2015 | $4,015 | $230,000 | $69,000 | $161,000 |
| 2014 | $3,117 | $165,000 | $49,500 | $115,500 |
Source: Public Records
Map
Nearby Homes
- 5444 Bancroft Ave
- 5553 Harvey Ave
- 5431 Ygnacio Ave
- 5315 Cole St
- 2007 57th Ave
- 2416 Kingsland Ave
- 5421 Wentworth Ave
- 5600 Foothill Blvd
- 2426 57th Ave
- 5540 E 17th St
- 5226 Belvedere St
- 5483 Wadean Place
- 1830 Vicksburg Ave
- 5800 E 17th St
- 5706 Brookdale Ave
- 1605 57th Ave
- 1604 57th Ave
- 2622 Kingsland Ave
- 5103 Fairfax Ave
- 5715 E 16th St
- 2040 55th Ave
- 2048 55th Ave
- 5514 Harmon Ave
- 2052 55th Ave
- 5520 Harmon Ave
- 2056 55th Ave
- 5517 Harvey Ave
- 5505 Harmon Ave
- 5526 Harmon Ave
- 2041 55th Ave
- 2060 55th Ave
- 5521 Harvey Ave
- 5489 Bancroft Ave
- 5483 Bancroft Ave
- 5525 Harvey Ave
- 2031 55th Ave
- 5519 Harmon Ave
- 5532 Harmon Ave
- 5499 Bancroft Ave
- 2020 55th Ave