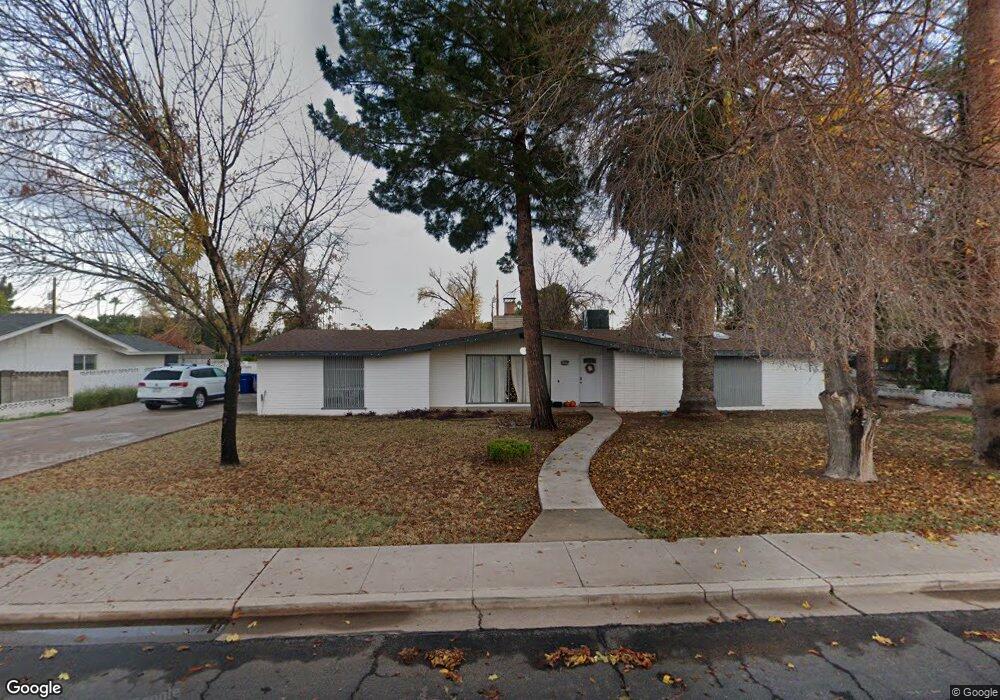
2044 E Huber St Mesa, AZ 85213
North Central Mesa NeighborhoodEstimated Value: $489,114 - $658,000
Studio
3
Baths
2,176
Sq Ft
$266/Sq Ft
Est. Value
About This Home
This home is located at 2044 E Huber St, Mesa, AZ 85213 and is currently estimated at $579,029, approximately $266 per square foot. 2044 E Huber St is a home located in Maricopa County with nearby schools including Hale Elementary School, Franklin at Brimhall Elementary School, and Franklin West Elementary School.
Ownership History
Date
Name
Owned For
Owner Type
Purchase Details
Closed on
Sep 1, 2020
Sold by
Carmack Bj W and Tukuafu Julie M
Bought by
Tukuafu Julie M
Current Estimated Value
Home Financials for this Owner
Home Financials are based on the most recent Mortgage that was taken out on this home.
Original Mortgage
$374,000
Outstanding Balance
$332,510
Interest Rate
3%
Mortgage Type
New Conventional
Estimated Equity
$246,519
Purchase Details
Closed on
Dec 4, 2018
Sold by
Blalack Naomi Lavonne and The Naomi Lavonne Blalack Livi
Bought by
Carmack Bj W and Tukuafu Julie M
Home Financials for this Owner
Home Financials are based on the most recent Mortgage that was taken out on this home.
Original Mortgage
$365,750
Interest Rate
4.8%
Mortgage Type
New Conventional
Purchase Details
Closed on
Apr 23, 1996
Sold by
Blalack Lavonne
Bought by
Blalack Naomi Lavonne and Naomi Lavonne Blalack Living Trust
Create a Home Valuation Report for This Property
The Home Valuation Report is an in-depth analysis detailing your home's value as well as a comparison with similar homes in the area
Home Values in the Area
Average Home Value in this Area
Purchase History
| Date | Buyer | Sale Price | Title Company |
|---|---|---|---|
| Tukuafu Julie M | -- | Pioneer Title Agency Inc | |
| Carmack Bj W | $385,000 | American Title Service Agenc | |
| Blalack Naomi Lavonne | -- | -- |
Source: Public Records
Mortgage History
| Date | Status | Borrower | Loan Amount |
|---|---|---|---|
| Open | Tukuafu Julie M | $374,000 | |
| Closed | Carmack Bj W | $365,750 |
Source: Public Records
Tax History
| Year | Tax Paid | Tax Assessment Tax Assessment Total Assessment is a certain percentage of the fair market value that is determined by local assessors to be the total taxable value of land and additions on the property. | Land | Improvement |
|---|---|---|---|---|
| 2025 | $1,935 | $24,458 | -- | -- |
| 2024 | $2,053 | $23,293 | -- | -- |
| 2023 | $2,053 | $37,350 | $7,470 | $29,880 |
| 2022 | $2,008 | $29,270 | $5,850 | $23,420 |
| 2021 | $2,063 | $28,070 | $5,610 | $22,460 |
| 2020 | $2,694 | $26,370 | $5,270 | $21,100 |
| 2019 | $1,886 | $24,150 | $4,830 | $19,320 |
| 2018 | $2,123 | $22,220 | $4,440 | $17,780 |
| 2017 | $2,060 | $21,950 | $4,390 | $17,560 |
| 2016 | $2,022 | $20,110 | $4,020 | $16,090 |
| 2015 | $1,900 | $18,010 | $3,600 | $14,410 |
Source: Public Records
Map
Nearby Homes
- 1905 E Gary St
- 1004 North Forest Unit 56
- 1312 N 24th St Unit 1
- 1745 N Ashbrook Cir
- 2204 E Fountain St
- 1456 N Gaylord Cir
- 1650 E Grandview St
- 1701 E Greenway St
- 1714 E Indigo St
- 2517 E Highland St
- 1824 N Acacia
- 1222 N 25th St
- 1625 E Greenway St
- 2521 E Inca St
- 1825 E Elmwood St
- 2325 E Elmwood St
- 2253 E Jaeger St
- 2511 E Fountain St
- 2554 E Fox St
- 841 N Gentry
- 2060 E Huber St
- 2032 E Huber St
- 2032 E Huber St
- 2059 E Hackamore St
- 2043 E Huber St
- 2106 E Huber St
- 2043 E Hackamore St
- 2043 E Hackamore St Unit 3
- 2059 E Huber St
- 2031 E Huber St
- 2105 E Huber St
- 1429 N Gilbert Rd
- 2118 E Huber St
- 2111 E Hackamore St
- 2048 E Gary Cir
- 2061 E Gary Cir
- 1351 N Gilbert Rd
- 2013 E Huber St
- 2121 E Huber St
- 2022 E Gary Cir
Your Personal Tour Guide
Ask me questions while you tour the home.