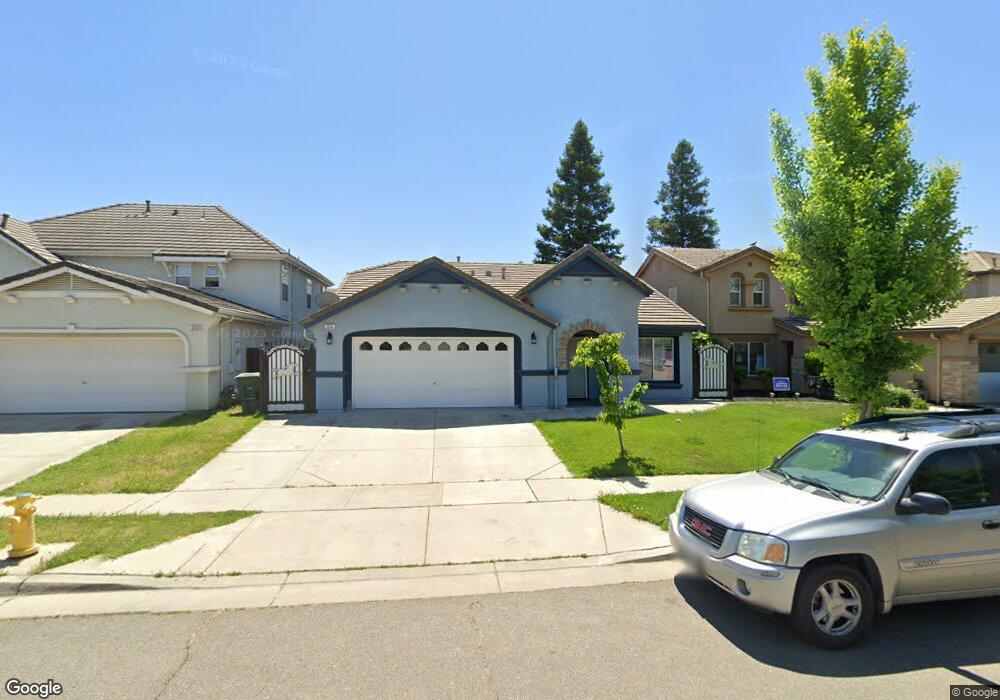
2044 Morgan Way Yuba City, CA 95993
Estimated Value: $190,000 - $458,000
3
Beds
2
Baths
1,613
Sq Ft
$227/Sq Ft
Est. Value
About This Home
This home is located at 2044 Morgan Way, Yuba City, CA 95993 and is currently estimated at $366,688, approximately $227 per square foot. 2044 Morgan Way is a home located in Sutter County with nearby schools including Lincoln Elementary School, Yuba City High School, and St. Isidore Catholic School.
Ownership History
Date
Name
Owned For
Owner Type
Purchase Details
Closed on
Jun 30, 2009
Sold by
Us Bank National Association
Bought by
Kahlon Balbin K and Deol Davinder S
Current Estimated Value
Home Financials for this Owner
Home Financials are based on the most recent Mortgage that was taken out on this home.
Original Mortgage
$140,000
Outstanding Balance
$91,373
Interest Rate
5.31%
Mortgage Type
New Conventional
Estimated Equity
$275,315
Purchase Details
Closed on
Apr 2, 2009
Sold by
Din Fazal
Bought by
Us Bank National Association
Purchase Details
Closed on
Aug 24, 2005
Sold by
Din Fazilat
Bought by
Din Fazal
Home Financials for this Owner
Home Financials are based on the most recent Mortgage that was taken out on this home.
Original Mortgage
$262,500
Interest Rate
1.9%
Mortgage Type
New Conventional
Purchase Details
Closed on
Jan 27, 2005
Sold by
Kb Home North Bay Inc
Bought by
Din Fazal and Din Fazilat
Home Financials for this Owner
Home Financials are based on the most recent Mortgage that was taken out on this home.
Original Mortgage
$195,264
Interest Rate
5.87%
Mortgage Type
New Conventional
Create a Home Valuation Report for This Property
The Home Valuation Report is an in-depth analysis detailing your home's value as well as a comparison with similar homes in the area
Home Values in the Area
Average Home Value in this Area
Purchase History
| Date | Buyer | Sale Price | Title Company |
|---|---|---|---|
| Kahlon Balbin K | $175,000 | Lsi Title Company | |
| Us Bank National Association | $139,000 | Accommodation | |
| Din Fazal | -- | North American Title Company | |
| Din Fazal | $244,500 | First American Title Co |
Source: Public Records
Mortgage History
| Date | Status | Borrower | Loan Amount |
|---|---|---|---|
| Open | Kahlon Balbin K | $140,000 | |
| Previous Owner | Din Fazal | $262,500 | |
| Previous Owner | Din Fazal | $195,264 | |
| Closed | Din Fazal | $48,817 |
Source: Public Records
Tax History Compared to Growth
Tax History
| Year | Tax Paid | Tax Assessment Tax Assessment Total Assessment is a certain percentage of the fair market value that is determined by local assessors to be the total taxable value of land and additions on the property. | Land | Improvement |
|---|---|---|---|---|
| 2025 | $3,358 | $225,341 | $51,502 | $173,839 |
| 2024 | $3,358 | $220,924 | $50,493 | $170,431 |
| 2023 | $3,358 | $216,593 | $49,503 | $167,090 |
| 2022 | $3,277 | $212,347 | $48,533 | $163,814 |
| 2021 | $3,200 | $208,198 | $47,588 | $160,610 |
| 2020 | $3,170 | $206,063 | $47,100 | $158,963 |
| 2019 | $3,094 | $202,021 | $46,176 | $155,845 |
| 2018 | $3,009 | $198,060 | $45,271 | $152,789 |
| 2017 | $2,954 | $194,176 | $44,383 | $149,793 |
| 2016 | $2,914 | $190,369 | $43,513 | $146,856 |
| 2015 | $2,884 | $187,509 | $42,859 | $144,650 |
| 2014 | $2,828 | $183,836 | $42,020 | $141,816 |
Source: Public Records
Map
Nearby Homes
- 1515 Jodi Dr
- 1524 Spyglass Dr
- 1372 Johnathan Dr
- 1180 Sanborn Rd
- 2038 Nicholas Dr
- 2021 Nand Dr
- 1105 Johnathan Dr
- 1811 Alyssa Dr
- 1981 Ash Ct
- 2185 Lincoln Rd
- 1150 Pico Ct
- Plan 2311 at Montego
- Plan 1924 at Montego
- Plan 1894 at Montego
- 1181 Robert Dr
- 1474 Smith Rd
- 1525 Bogue Rd
- 2399 Holcomb Ave
- 0 Victoria Ct
- 1421 Richland Rd
- 2034 Morgan Way
- 2024 Morgan Way
- 2064 Morgan Way
- 2045 La Rabyn Way
- 2035 La Rabyn Way
- 2055 La Rabyn Way
- 2043 Morgan Way
- 2025 La Rabyn Way
- 2065 La Rabyn Way
- 2014 Morgan Way
- 2033 Morgan Way
- 2053 Morgan Way
- 2023 Morgan Way
- 2063 Morgan Way
- 2015 La Rabyn Way
- 1450 Sanborn Rd
- 1460 Sanborn Rd
- 2013 Morgan Way
- 2073 Morgan Way
- 2004 Morgan Way