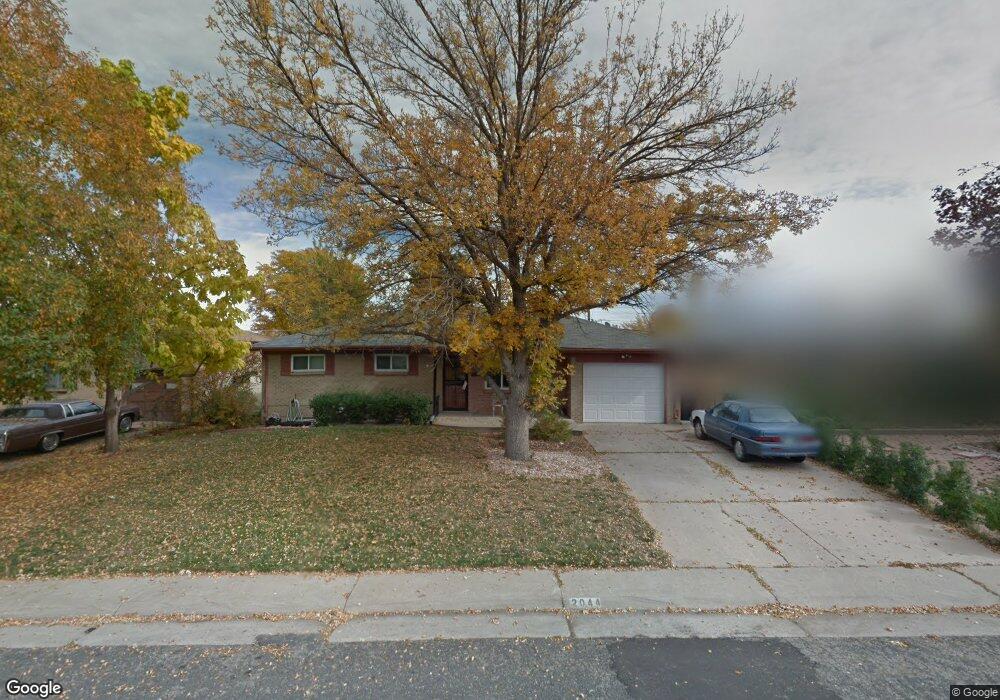
2044 S Xavier St Denver, CO 80219
Harvey Park NeighborhoodEstimated Value: $559,000 - $648,000
4
Beds
3
Baths
2,767
Sq Ft
$221/Sq Ft
Est. Value
About This Home
This home is located at 2044 S Xavier St, Denver, CO 80219 and is currently estimated at $611,841, approximately $221 per square foot. 2044 S Xavier St is a home located in Denver County with nearby schools including Doull Elementary School, Bear Valley International School, and Excel Academy.
Ownership History
Date
Name
Owned For
Owner Type
Purchase Details
Closed on
Sep 16, 2011
Sold by
Pohl Greg S
Bought by
Romero Nicole S
Current Estimated Value
Home Financials for this Owner
Home Financials are based on the most recent Mortgage that was taken out on this home.
Original Mortgage
$189,593
Outstanding Balance
$129,770
Interest Rate
4.25%
Mortgage Type
FHA
Estimated Equity
$482,071
Purchase Details
Closed on
Oct 5, 2007
Sold by
Pohl Greg S and Mills Ruby M
Bought by
Pohl Greg S
Home Financials for this Owner
Home Financials are based on the most recent Mortgage that was taken out on this home.
Original Mortgage
$219,200
Interest Rate
6.48%
Mortgage Type
New Conventional
Purchase Details
Closed on
Jun 27, 2003
Sold by
Neuroth Vincent L and Neuroth Ruth J
Bought by
Pohl Greg S and Mills Ruby M
Home Financials for this Owner
Home Financials are based on the most recent Mortgage that was taken out on this home.
Original Mortgage
$199,000
Interest Rate
5.27%
Mortgage Type
Unknown
Create a Home Valuation Report for This Property
The Home Valuation Report is an in-depth analysis detailing your home's value as well as a comparison with similar homes in the area
Home Values in the Area
Average Home Value in this Area
Purchase History
| Date | Buyer | Sale Price | Title Company |
|---|---|---|---|
| Romero Nicole S | $194,525 | First American | |
| Pohl Greg S | -- | None Available | |
| Pohl Greg S | $239,000 | First American Heritage Titl |
Source: Public Records
Mortgage History
| Date | Status | Borrower | Loan Amount |
|---|---|---|---|
| Open | Romero Nicole S | $189,593 | |
| Previous Owner | Pohl Greg S | $219,200 | |
| Previous Owner | Pohl Greg S | $199,000 |
Source: Public Records
Tax History Compared to Growth
Tax History
| Year | Tax Paid | Tax Assessment Tax Assessment Total Assessment is a certain percentage of the fair market value that is determined by local assessors to be the total taxable value of land and additions on the property. | Land | Improvement |
|---|---|---|---|---|
| 2024 | $3,034 | $38,310 | $3,210 | $35,100 |
| 2023 | $2,969 | $38,310 | $3,210 | $35,100 |
| 2022 | $2,360 | $29,670 | $7,150 | $22,520 |
| 2021 | $2,278 | $30,530 | $7,360 | $23,170 |
| 2020 | $2,111 | $28,450 | $6,860 | $21,590 |
| 2019 | $2,052 | $28,450 | $6,860 | $21,590 |
| 2018 | $1,721 | $22,250 | $5,930 | $16,320 |
| 2017 | $1,716 | $22,250 | $5,930 | $16,320 |
| 2016 | $1,580 | $19,370 | $5,461 | $13,909 |
| 2015 | $1,513 | $19,370 | $5,461 | $13,909 |
| 2014 | $1,315 | $15,830 | $2,730 | $13,100 |
Source: Public Records
Map
Nearby Homes
- 2067 S Yates St
- 2090 S Wolff St
- 2088 S Winona Ct
- 1830 S Xavier St
- 2061 S Stuart St
- 5704 W Asbury Place Unit 204
- 5317 W Iliff Dr Unit 101
- 5735 W Atlantic Place Unit 101
- 5745 W Atlantic Place Unit 206
- 5745 W Atlantic Place Unit 104
- 5745 W Atlantic Place Unit 207
- 5337 W Iliff Dr Unit 105
- 5732 W Atlantic Place Unit 102
- 2046 S Quitman St
- 1646 S Winona Ct
- 1626 S Xavier St
- 2529 S Utica St
- 1883 S Perry Way
- 2123 S Gray St
- 1550 S Xavier St
- 2024 S Xavier St
- 2054 S Xavier St
- 2014 S Xavier St
- 2064 S Xavier St
- 2023 S Wolcott Ct
- 2043 S Wolcott Ct
- 2053 S Wolcott Ct
- 2045 S Xavier St
- 2025 S Xavier St
- 2055 S Xavier St
- 2063 S Wolcott Ct
- 2004 S Xavier St
- 2013 S Wolcott Ct
- 2074 S Xavier St
- 2015 S Xavier St
- 2065 S Xavier St
- 2073 S Wolcott Ct
- 2003 S Wolcott Ct
- 2005 S Xavier St
- 1994 S Xavier St