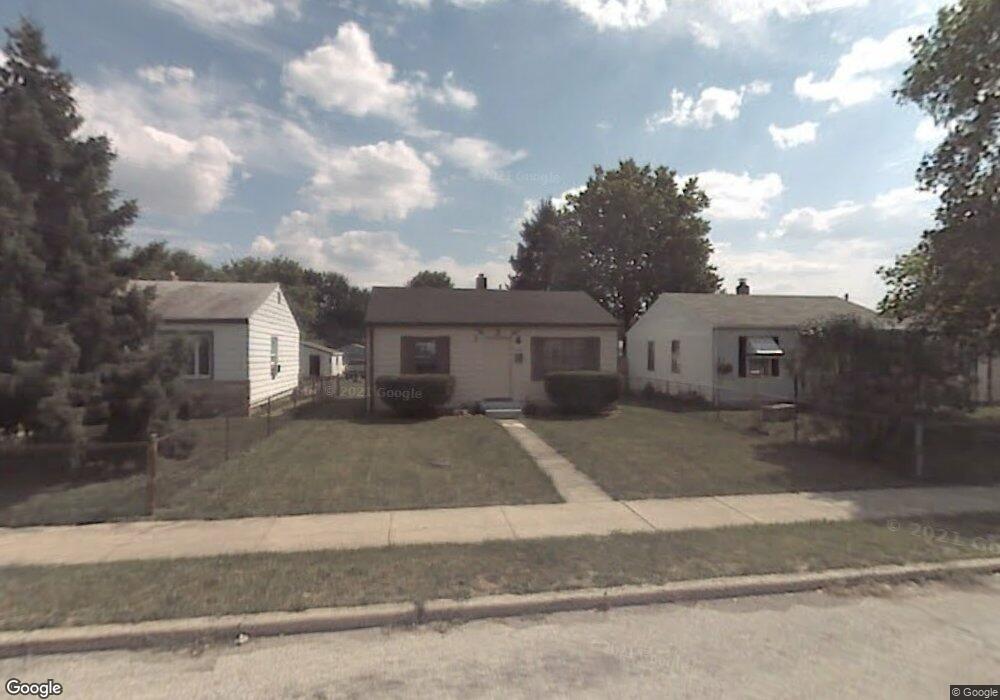
2045 Calhoun St Indianapolis, IN 46203
Near Southeast NeighborhoodEstimated Value: $76,000 - $142,000
2
Beds
1
Bath
672
Sq Ft
$169/Sq Ft
Est. Value
About This Home
This home is located at 2045 Calhoun St, Indianapolis, IN 46203 and is currently estimated at $113,734, approximately $169 per square foot. 2045 Calhoun St is a home located in Marion County with nearby schools including Eleanor Skillen School No. 34, Ralph Waldo Emerson School 58, and George W. Julian School No. 57.
Ownership History
Date
Name
Owned For
Owner Type
Purchase Details
Closed on
Jun 3, 2024
Sold by
Bradshaw Connie J
Bought by
Indy Realty Investing Llc
Current Estimated Value
Purchase Details
Closed on
May 30, 2024
Sold by
Bradshaw Connie J
Bought by
Indy Realty Investing Llc
Purchase Details
Closed on
Sep 25, 2008
Sold by
Fannie Mae
Bought by
Bradshaw Connie J
Purchase Details
Closed on
Aug 21, 2008
Sold by
Ball Brenda J
Bought by
Citimortgage Inc
Purchase Details
Closed on
Jun 26, 2007
Sold by
Whiteside Gary
Bought by
Ball Brenda J
Home Financials for this Owner
Home Financials are based on the most recent Mortgage that was taken out on this home.
Original Mortgage
$57,000
Interest Rate
6.69%
Mortgage Type
New Conventional
Purchase Details
Closed on
Apr 2, 2007
Sold by
Abn Amro Mortgage Group Inc
Bought by
Whiteside Gary
Purchase Details
Closed on
Oct 2, 2006
Sold by
Peoples Susan D
Bought by
Abn Amro Mortgage Group Inc
Create a Home Valuation Report for This Property
The Home Valuation Report is an in-depth analysis detailing your home's value as well as a comparison with similar homes in the area
Home Values in the Area
Average Home Value in this Area
Purchase History
| Date | Buyer | Sale Price | Title Company |
|---|---|---|---|
| Indy Realty Investing Llc | -- | Eagle Land Title | |
| Indy Realty Investing Llc | $65,000 | Eagle Land Title | |
| Bradshaw Connie J | -- | None Available | |
| Citimortgage Inc | $51,983 | None Available | |
| Ball Brenda J | -- | None Available | |
| Whiteside Gary | -- | None Available | |
| Abn Amro Mortgage Group Inc | $55,000 | None Available |
Source: Public Records
Mortgage History
| Date | Status | Borrower | Loan Amount |
|---|---|---|---|
| Previous Owner | Ball Brenda J | $57,000 |
Source: Public Records
Tax History
| Year | Tax Paid | Tax Assessment Tax Assessment Total Assessment is a certain percentage of the fair market value that is determined by local assessors to be the total taxable value of land and additions on the property. | Land | Improvement |
|---|---|---|---|---|
| 2024 | $1,497 | $57,300 | $8,900 | $48,400 |
| 2023 | $1,497 | $59,400 | $8,900 | $50,500 |
| 2022 | $1,632 | $65,500 | $8,900 | $56,600 |
| 2021 | $1,097 | $43,900 | $8,900 | $35,000 |
| 2020 | $1,043 | $41,500 | $8,900 | $32,600 |
| 2019 | $890 | $34,300 | $3,500 | $30,800 |
| 2018 | $860 | $32,800 | $3,500 | $29,300 |
| 2017 | $720 | $30,300 | $3,500 | $26,800 |
| 2016 | $665 | $28,400 | $3,500 | $24,900 |
| 2014 | $543 | $25,100 | $3,500 | $21,600 |
| 2013 | $470 | $22,600 | $3,500 | $19,100 |
Source: Public Records
Map
Nearby Homes
- 2062 Calhoun St
- 2344 Saint Paul St
- 2826 Villa Ave
- 2305 E Legrande Ave
- 1850 E Legrande Ave
- 1117 Villa Ave
- 2310 E Raymond St
- 1523 Harlan St
- 2220 Villa Ave
- 2233 Saint Paul St
- 2240 Saint Paul St
- 2240 Saint Peter St
- 1827 Calvin St
- 1931 S State Ave
- 2329 Saint Paul St
- 1739 S State Ave
- 1721 Dawson St
- 2343 Saint Peter St
- 2412 Harlan St
- 1426 E Bradbury Ave
- 2041 Calhoun St
- 2049 Calhoun St
- 2037 Calhoun St
- 2053 Calhoun St
- 2033 Calhoun St
- 2057 Calhoun St
- 2029 Calhoun St
- 2061 Calhoun St
- 2044 E Legrande Ave
- 2042 E Legrande Ave
- 2048 E Legrande Ave
- 2025 Calhoun St
- 2065 Calhoun St
- 2038 E Legrande Ave
- 2052 E Legrande Ave
- 2046 Calhoun St
- 2050 Calhoun St
- 2042 Calhoun St
- 2034 E Legrande Ave
- 2054 Calhoun St
Your Personal Tour Guide
Ask me questions while you tour the home.