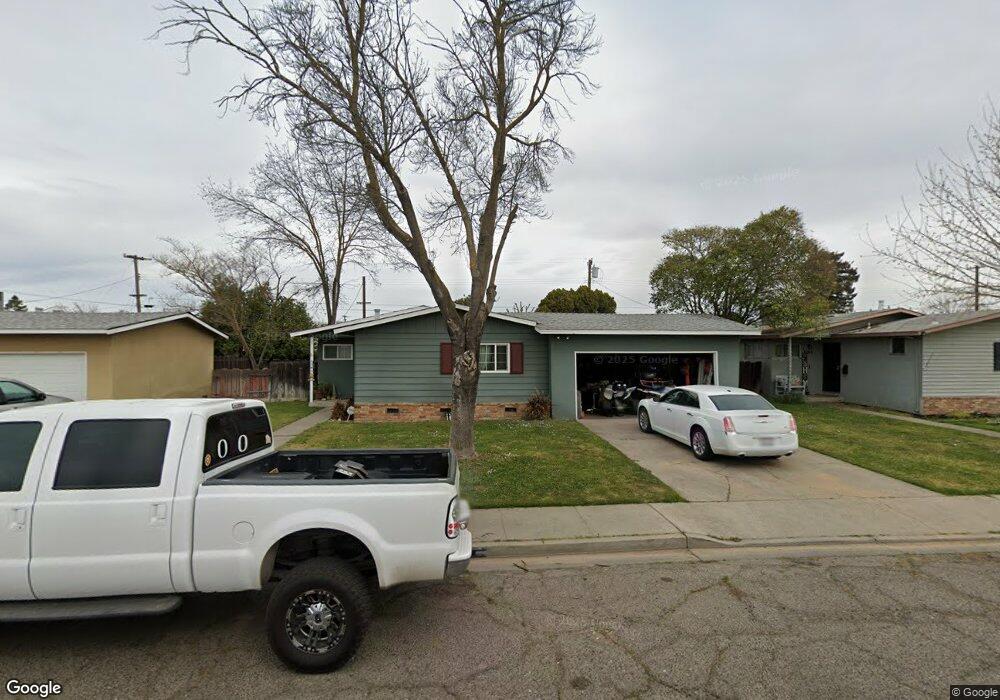
2045 Carrigan St Turlock, CA 95380
Estimated Value: $273,000 - $398,000
3
Beds
2
Baths
1,028
Sq Ft
$346/Sq Ft
Est. Value
About This Home
This home is located at 2045 Carrigan St, Turlock, CA 95380 and is currently estimated at $355,297, approximately $345 per square foot. 2045 Carrigan St is a home located in Stanislaus County with nearby schools including Julien Elementary School, Marvin A. Dutcher Middle School, and Turlock Junior High School.
Ownership History
Date
Name
Owned For
Owner Type
Purchase Details
Closed on
Dec 15, 2006
Sold by
Arnot Deborah K
Bought by
Arnot Sousa Deborah K
Current Estimated Value
Home Financials for this Owner
Home Financials are based on the most recent Mortgage that was taken out on this home.
Original Mortgage
$41,000
Outstanding Balance
$24,391
Interest Rate
6.22%
Mortgage Type
New Conventional
Estimated Equity
$330,906
Purchase Details
Closed on
Mar 25, 1996
Sold by
Freitag Elizabeth Catherine and Schuck William Jacob
Bought by
Arnot Deborah K
Home Financials for this Owner
Home Financials are based on the most recent Mortgage that was taken out on this home.
Original Mortgage
$84,867
Outstanding Balance
$3,313
Interest Rate
6.98%
Mortgage Type
FHA
Estimated Equity
$351,984
Create a Home Valuation Report for This Property
The Home Valuation Report is an in-depth analysis detailing your home's value as well as a comparison with similar homes in the area
Home Values in the Area
Average Home Value in this Area
Purchase History
| Date | Buyer | Sale Price | Title Company |
|---|---|---|---|
| Arnot Sousa Deborah K | -- | Chicago Title Co | |
| Arnot Deborah K | $85,000 | North American Title Ins Co |
Source: Public Records
Mortgage History
| Date | Status | Borrower | Loan Amount |
|---|---|---|---|
| Open | Arnot Sousa Deborah K | $41,000 | |
| Open | Arnot Deborah K | $84,867 |
Source: Public Records
Tax History Compared to Growth
Tax History
| Year | Tax Paid | Tax Assessment Tax Assessment Total Assessment is a certain percentage of the fair market value that is determined by local assessors to be the total taxable value of land and additions on the property. | Land | Improvement |
|---|---|---|---|---|
| 2025 | $1,443 | $141,187 | $66,440 | $74,747 |
| 2024 | $1,415 | $138,420 | $65,138 | $73,282 |
| 2023 | $1,411 | $135,707 | $63,861 | $71,846 |
| 2022 | $1,392 | $133,047 | $62,609 | $70,438 |
| 2021 | $1,370 | $130,439 | $61,382 | $69,057 |
| 2020 | $1,359 | $129,102 | $60,753 | $68,349 |
| 2019 | $1,335 | $126,571 | $59,562 | $67,009 |
| 2018 | $1,332 | $124,091 | $58,395 | $65,696 |
| 2017 | $1,300 | $121,658 | $57,250 | $64,408 |
| 2016 | $1,213 | $119,274 | $56,128 | $63,146 |
| 2015 | $1,201 | $117,483 | $55,285 | $62,198 |
| 2014 | $1,187 | $115,183 | $54,203 | $60,980 |
Source: Public Records
Map
Nearby Homes
- 1990 E Marshall St
- 2335 E Canal Dr
- 2500 E Marshall St
- 820 N Berkeley Ave
- 1509 Sycamore St
- 2521 East Ave
- 2676 Oppelt Way
- 1598 East Ave
- 1409 E Marshall St
- 1400 Sycamore St
- 716 N Daubenberger Rd
- 1311 Cahill Ave
- 658 Oak St
- 1015 E Main St
- 1440 Sherwood Dr
- 951 E Main St
- 1370 East Ave
- 1950 Simon Dr
- 1535 Niel Ave
- 1781 N Johnson Rd
- 2065 Carrigan St
- 2025 Carrigan St
- 2040 Tokay Ave
- 2085 Carrigan St
- 2005 Carrigan St
- 2020 Tokay Ave
- 2060 Tokay Ave
- 2040 Carrigan St
- 2020 Carrigan St
- 2060 Carrigan St
- 2000 Tokay Ave
- 2080 Tokay Ave
- 2105 Carrigan St
- 2000 Carrigan St
- 2080 Carrigan St
- 2100 Tokay Ave
- 2100 Carrigan St
- 2125 Carrigan St
- 2045 Zinfandel Ln
- 2045 Tokay Ave