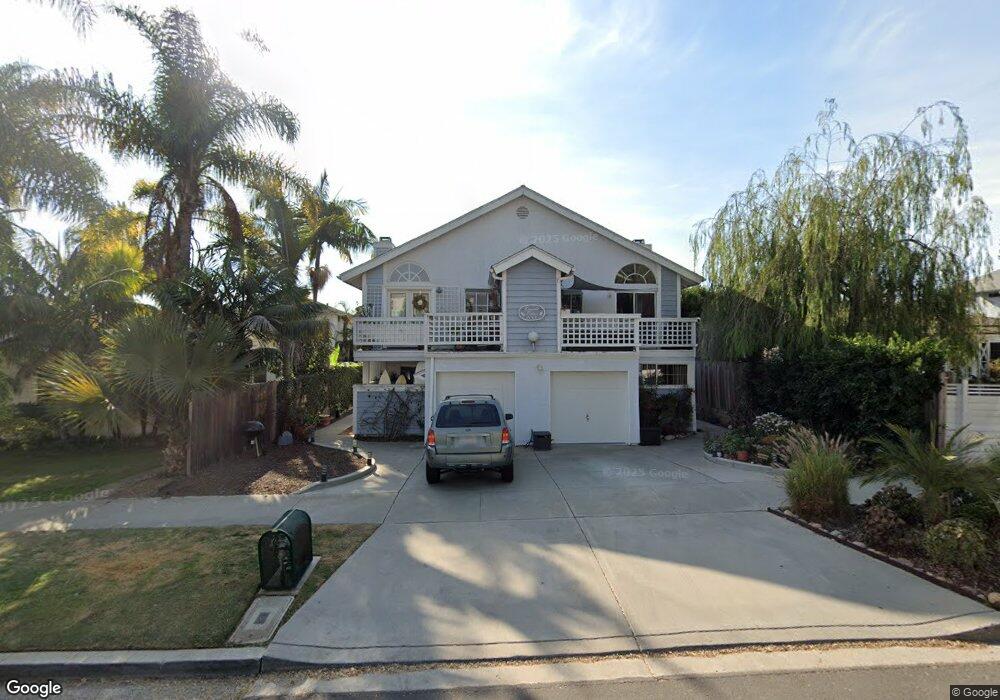
2045 Emerald St Unit 4 San Diego, CA 92109
Pacific Beach NeighborhoodEstimated Value: $857,000 - $1,162,000
3
Beds
3
Baths
1,285
Sq Ft
$802/Sq Ft
Est. Value
About This Home
This home is located at 2045 Emerald St Unit 4, San Diego, CA 92109 and is currently estimated at $1,030,252, approximately $801 per square foot. 2045 Emerald St Unit 4 is a home located in San Diego County with nearby schools including Sessions Elementary School, Pacific Beach Middle, and Mission Bay High School.
Ownership History
Date
Name
Owned For
Owner Type
Purchase Details
Closed on
Mar 10, 2016
Sold by
Ireland Kevin
Bought by
The Ireland Family Trust
Current Estimated Value
Purchase Details
Closed on
Apr 9, 2015
Sold by
Lamp Laura Lee
Bought by
Ireland Kevin
Purchase Details
Closed on
Feb 22, 2013
Sold by
Ireland William R and Ireland Kevin G
Bought by
Ireland William R
Purchase Details
Closed on
Sep 20, 2012
Sold by
Stein Erwin and Stein Margaret A
Bought by
Ireland William R and Ireland Edna Mae
Home Financials for this Owner
Home Financials are based on the most recent Mortgage that was taken out on this home.
Original Mortgage
$222,000
Outstanding Balance
$153,687
Interest Rate
3.58%
Mortgage Type
New Conventional
Estimated Equity
$876,565
Purchase Details
Closed on
Mar 6, 2008
Sold by
Stein Erwin and Stein Margaret A
Bought by
Stein Erwin and Stein Margaret A
Purchase Details
Closed on
Oct 30, 1987
Create a Home Valuation Report for This Property
The Home Valuation Report is an in-depth analysis detailing your home's value as well as a comparison with similar homes in the area
Home Values in the Area
Average Home Value in this Area
Purchase History
| Date | Buyer | Sale Price | Title Company |
|---|---|---|---|
| The Ireland Family Trust | -- | None Available | |
| Ireland Kevin | -- | None Available | |
| Ireland William R | -- | None Available | |
| Ireland William R | $410,000 | Fidelity National Title Co | |
| Stein Erwin | -- | None Available | |
| -- | $164,000 | -- |
Source: Public Records
Mortgage History
| Date | Status | Borrower | Loan Amount |
|---|---|---|---|
| Open | Ireland William R | $222,000 |
Source: Public Records
Tax History Compared to Growth
Tax History
| Year | Tax Paid | Tax Assessment Tax Assessment Total Assessment is a certain percentage of the fair market value that is determined by local assessors to be the total taxable value of land and additions on the property. | Land | Improvement |
|---|---|---|---|---|
| 2025 | $6,110 | $504,872 | $202,020 | $302,852 |
| 2024 | $6,110 | $494,973 | $198,059 | $296,914 |
| 2023 | $5,976 | $485,269 | $194,176 | $291,093 |
| 2022 | $5,817 | $475,755 | $190,369 | $285,386 |
| 2021 | $5,778 | $466,428 | $186,637 | $279,791 |
| 2020 | $5,708 | $461,647 | $184,724 | $276,923 |
| 2019 | $5,606 | $452,596 | $181,102 | $271,494 |
| 2018 | $5,242 | $443,722 | $177,551 | $266,171 |
| 2017 | $5,118 | $435,022 | $174,070 | $260,952 |
| 2016 | $5,036 | $426,493 | $170,657 | $255,836 |
| 2015 | $4,962 | $420,088 | $168,094 | $251,994 |
| 2014 | $4,884 | $411,860 | $164,802 | $247,058 |
Source: Public Records
Map
Nearby Homes
- 2045 Emerald St Unit 3
- 2036-38 Emerald St
- 2114 Felspar St
- 2050 Garnet Ave
- 2020 Diamond St Unit 12
- 4730 Noyes St Unit 106
- 4750 Noyes St Unit 110
- 2002 Missouri St Unit 6
- 1956 Hornblend St Unit 8
- 2128 Missouri St
- 4600 Lamont St Unit 4-103
- 1855 Diamond St Unit 201
- 1775 Diamond St Unit 220
- 1855 Diamond St Unit 5-309
- 1855 Diamond St Unit 228
- 1828 Diamond St Unit 3
- 1885 Diamond St Unit 133
- 1885 Diamond St Unit 2-235
- 1885 Diamond St Unit 2-234
- 1885 Diamond St Unit 310
- 2045 Emerald St Unit 2
- 2045 Emerald St Unit 1
- 2049 Emerald St Unit 55
- 2033 Emerald St Unit 35
- 2055 Emerald St
- 2027 Emerald St Unit D
- 2027 Emerald St Unit C
- 2027 Emerald St Unit B
- 2027 Emerald St Unit A
- 2057 Emerald St Unit 63
- 2050 Felspar St Unit 56
- 2046 Felspar St
- 2065-71 Emerald St
- 2065 Emerald St
- 2019 Emerald St
- 2036 Felspar St Unit 38
- 2058 Felspar St Unit 64
- 2030 Felspar St
- 2066 Felspar St Unit 72
- 2073-2079 Emerald St