2045 Fearn Ave Los Osos, CA 93402
Estimated Value: $1,209,000 - $1,565,934
3
Beds
3
Baths
2,993
Sq Ft
$456/Sq Ft
Est. Value
About This Home
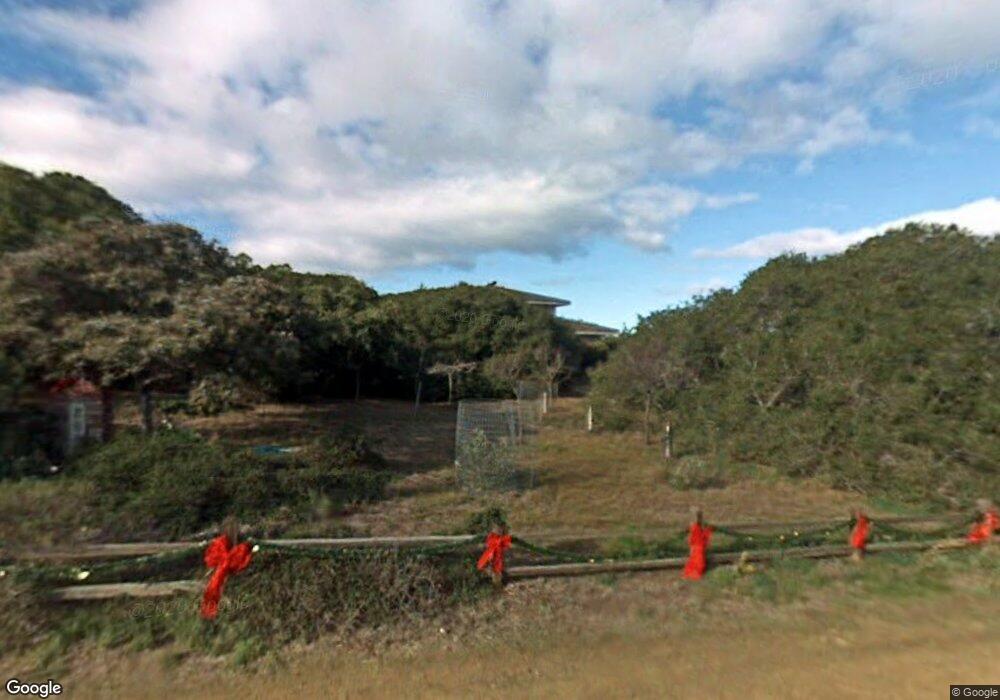
This home is located at 2045 Fearn Ave, Los Osos, CA 93402 and is currently estimated at $1,363,734, approximately $455 per square foot. 2045 Fearn Ave is a home located in San Luis Obispo County with nearby schools including Monarch Grove Elementary School, Los Osos Middle School, and Morro Bay High School.
Ownership History
Date
Name
Owned For
Owner Type
Purchase Details
Closed on
Mar 5, 2018
Sold by
Curren Elizabeth Birge
Bought by
Curren Elizabeth Birge
Current Estimated Value
Purchase Details
Closed on
Mar 3, 2018
Sold by
Curren Jane Michael
Bought by
Curren Elizabeth Birge
Purchase Details
Closed on
Oct 27, 1995
Sold by
Curren Michael E and Curren Michael C
Bought by
Curren Michael Edward
Create a Home Valuation Report for This Property
The Home Valuation Report is an in-depth analysis detailing your home's value as well as a comparison with similar homes in the area
Home Values in the Area
Average Home Value in this Area
Purchase History
| Date | Buyer | Sale Price | Title Company |
|---|---|---|---|
| Curren Elizabeth Birge | -- | None Available | |
| Curren Elizabeth Birge | -- | None Available | |
| Curren Michael Edward | -- | -- | |
| Curren Elizabeth Birge | -- | -- |
Source: Public Records
Tax History Compared to Growth
Tax History
| Year | Tax Paid | Tax Assessment Tax Assessment Total Assessment is a certain percentage of the fair market value that is determined by local assessors to be the total taxable value of land and additions on the property. | Land | Improvement |
|---|---|---|---|---|
| 2025 | $4,691 | $428,475 | $113,657 | $314,818 |
| 2024 | $16,726 | $420,075 | $111,429 | $308,646 |
| 2023 | $16,726 | $1,500,000 | $850,000 | $650,000 |
| 2022 | $4,317 | $403,765 | $107,103 | $296,662 |
| 2021 | $4,244 | $395,849 | $105,003 | $290,846 |
| 2020 | $4,199 | $391,791 | $103,927 | $287,864 |
| 2019 | $4,153 | $384,110 | $101,890 | $282,220 |
| 2018 | $4,069 | $376,580 | $99,893 | $276,687 |
| 2017 | $3,987 | $369,197 | $97,935 | $271,262 |
| 2016 | $3,907 | $361,959 | $96,015 | $265,944 |
| 2015 | $3,846 | $356,523 | $94,573 | $261,950 |
| 2014 | $3,537 | $349,540 | $92,721 | $256,819 |
Source: Public Records
Map
Nearby Homes