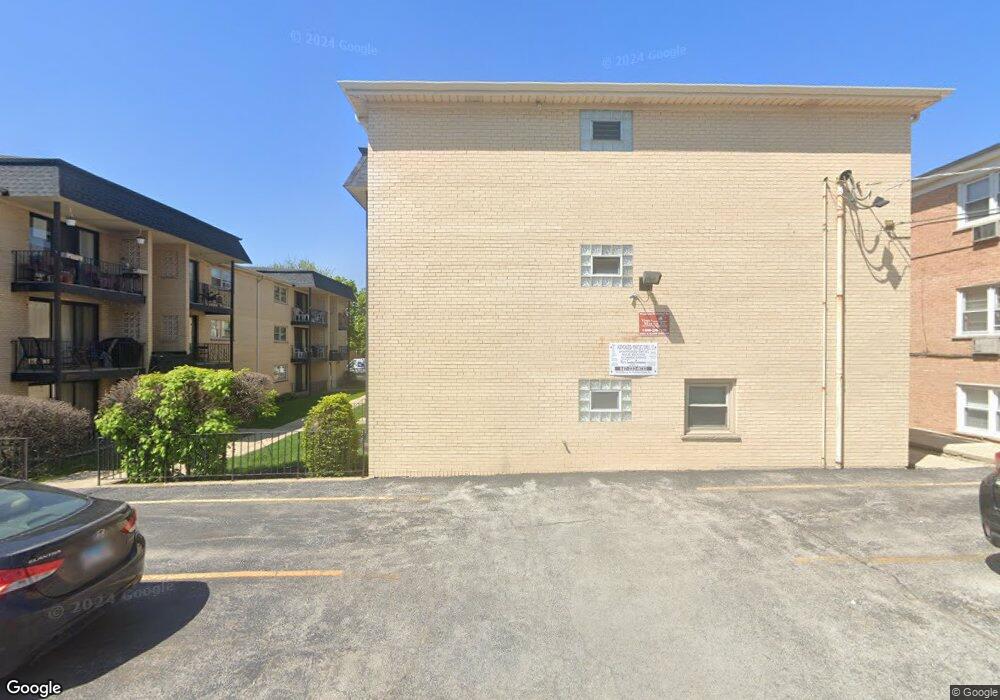
2045 N Harlem Ave Unit 20451E Chicago, IL 60707
Galewood NeighborhoodEstimated Value: $141,000 - $185,000
1
Bed
1
Bath
1,100
Sq Ft
$145/Sq Ft
Est. Value
About This Home
This home is located at 2045 N Harlem Ave Unit 20451E, Chicago, IL 60707 and is currently estimated at $159,049, approximately $144 per square foot. 2045 N Harlem Ave Unit 20451E is a home located in Cook County with nearby schools including Sayre Elementary Language Academy, Steinmetz College Prep, and St. William School.
Ownership History
Date
Name
Owned For
Owner Type
Purchase Details
Closed on
Mar 14, 2022
Sold by
The Estate Of John G Zak
Bought by
Hill Samuel L
Current Estimated Value
Home Financials for this Owner
Home Financials are based on the most recent Mortgage that was taken out on this home.
Original Mortgage
$101,610
Outstanding Balance
$94,937
Interest Rate
3.92%
Estimated Equity
$64,113
Purchase Details
Closed on
Feb 24, 2022
Sold by
The Estate Of John G Zak
Bought by
Hill Samuel L
Home Financials for this Owner
Home Financials are based on the most recent Mortgage that was taken out on this home.
Original Mortgage
$101,610
Outstanding Balance
$94,937
Interest Rate
3.92%
Estimated Equity
$64,113
Purchase Details
Closed on
Oct 13, 1999
Sold by
Gelsomino Louise A
Bought by
Zak John G
Home Financials for this Owner
Home Financials are based on the most recent Mortgage that was taken out on this home.
Original Mortgage
$56,000
Interest Rate
7.91%
Create a Home Valuation Report for This Property
The Home Valuation Report is an in-depth analysis detailing your home's value as well as a comparison with similar homes in the area
Home Values in the Area
Average Home Value in this Area
Purchase History
| Date | Buyer | Sale Price | Title Company |
|---|---|---|---|
| Hill Samuel L | $113,000 | -- | |
| Hill Samuel L | $113,000 | -- | |
| Zak John G | $60,000 | -- |
Source: Public Records
Mortgage History
| Date | Status | Borrower | Loan Amount |
|---|---|---|---|
| Open | Hill Samuel L | $101,610 | |
| Closed | Hill Samuel L | $101,610 | |
| Previous Owner | Zak John G | $56,000 |
Source: Public Records
Tax History Compared to Growth
Tax History
| Year | Tax Paid | Tax Assessment Tax Assessment Total Assessment is a certain percentage of the fair market value that is determined by local assessors to be the total taxable value of land and additions on the property. | Land | Improvement |
|---|---|---|---|---|
| 2024 | $2,332 | $13,823 | $2,758 | $11,065 |
| 2023 | $1,569 | $11,046 | $2,224 | $8,822 |
| 2022 | $1,569 | $11,046 | $2,224 | $8,822 |
| 2021 | $1,552 | $11,045 | $2,224 | $8,821 |
| 2020 | $1,575 | $10,167 | $1,112 | $9,055 |
| 2019 | $1,608 | $11,428 | $1,112 | $10,316 |
| 2018 | $1,580 | $11,428 | $1,112 | $10,316 |
| 2017 | $1,281 | $9,325 | $978 | $8,347 |
| 2016 | $1,225 | $9,325 | $978 | $8,347 |
| 2015 | $1,091 | $9,325 | $978 | $8,347 |
| 2014 | $1,540 | $11,596 | $934 | $10,662 |
| 2013 | $1,632 | $11,596 | $934 | $10,662 |
Source: Public Records
Map
Nearby Homes
- 2037 N Harlem Ave Unit 3E
- 7182 W Dickens Ave Unit 2W
- 2016 N Harlem Ave Unit 7W
- 2028 N 72nd Ct
- 2054 N Nordica Ave
- 2013 N 73rd Ave
- 1930 N Harlem Ave Unit 306
- 1930 N Harlem Ave Unit 402
- 2024 N 73rd Ave
- 2000 73rd Ave
- 1911 N 73rd Ave
- 2222 N Harlem Ave Unit 2NW
- 2234 N Neva Ave
- 2122 N 73rd Ct
- 2224 N Nordica Ave
- 2037 N 74th Ave Unit 3
- 2142 N 73rd Ct
- 1905 N Nordica Ave
- 2221 N 73rd Ct
- 7036 W Belden Ave
- 2045 N Harlem Ave Unit 3W
- 2045 N Harlem Ave Unit 20453E
- 2045 N Harlem Ave Unit 20452W
- 2045 N Harlem Ave Unit 20453W
- 2045 N Harlem Ave Unit 20452E
- 2045 N Harlem Ave Unit 20451W
- 2045 N Harlem Ave Unit 2W
- 2045 N Harlem Ave Unit 2E
- 2045 N Harlem Ave Unit 1W
- 2045 N Harlem Ave Unit 1E
- 2037 N Harlem Ave Unit 20373E
- 2037 N Harlem Ave Unit 20371E
- 2037 N Harlem Ave Unit 20371W
- 2037 N Harlem Ave Unit 20372W
- 2037 N Harlem Ave Unit 20411E
- 2037 N Harlem Ave Unit 20373W
- 2037 N Harlem Ave Unit 20372E
- 2037 N Harlem Ave Unit 3W
- 7195 W Dickens Ave
- 2035 N Harlem Ave