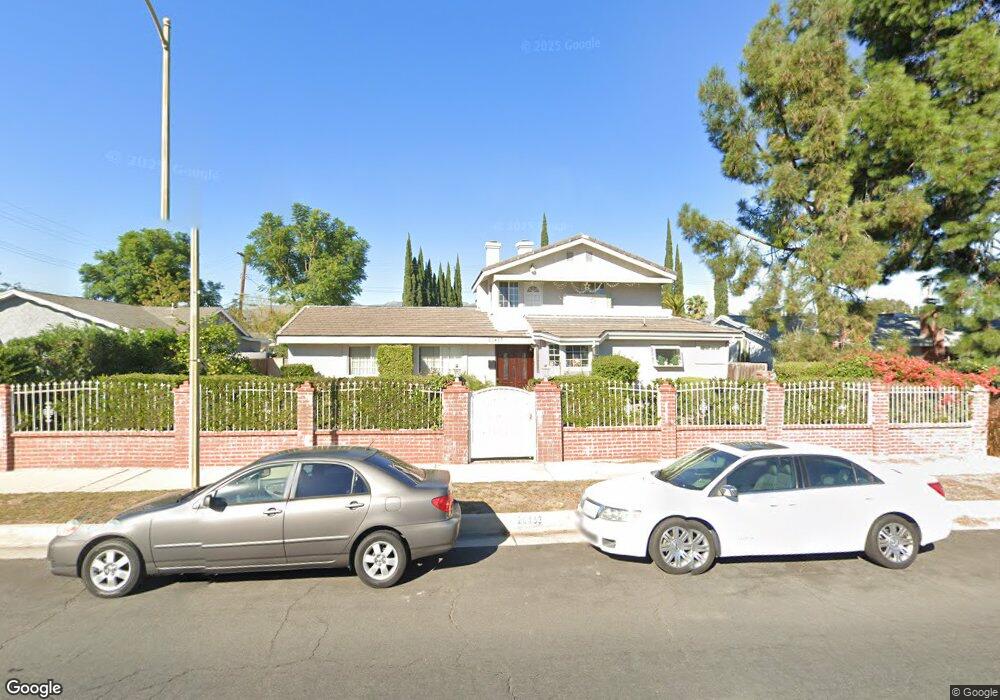
20453 Lassen St Chatsworth, CA 91311
Estimated Value: $1,021,000 - $1,082,105
6
Beds
3
Baths
2,943
Sq Ft
$360/Sq Ft
Est. Value
About This Home
This home is located at 20453 Lassen St, Chatsworth, CA 91311 and is currently estimated at $1,059,776, approximately $360 per square foot. 20453 Lassen St is a home located in Los Angeles County with nearby schools including Ernest Lawrence Middle School, Superior Street Elementary School, and Our Community School.
Ownership History
Date
Name
Owned For
Owner Type
Purchase Details
Closed on
Nov 23, 2010
Sold by
Page Ellie
Bought by
Cherian Pauli and Joseph Cherian P
Current Estimated Value
Home Financials for this Owner
Home Financials are based on the most recent Mortgage that was taken out on this home.
Original Mortgage
$394,685
Outstanding Balance
$266,703
Interest Rate
4.75%
Mortgage Type
FHA
Estimated Equity
$793,073
Purchase Details
Closed on
Mar 24, 2003
Sold by
Rothschild Irene
Bought by
The Irene Rothschild Living Trust
Purchase Details
Closed on
Jul 23, 1999
Sold by
Federal Home Loan Mortgage Corporation
Bought by
Rothschild Irene
Home Financials for this Owner
Home Financials are based on the most recent Mortgage that was taken out on this home.
Original Mortgage
$180,000
Interest Rate
7.64%
Purchase Details
Closed on
Sep 28, 1998
Sold by
Norwest Mtg Inc
Bought by
Federal Home Loan Mortgage Corporation
Create a Home Valuation Report for This Property
The Home Valuation Report is an in-depth analysis detailing your home's value as well as a comparison with similar homes in the area
Home Values in the Area
Average Home Value in this Area
Purchase History
| Date | Buyer | Sale Price | Title Company |
|---|---|---|---|
| Cherian Pauli | $400,000 | Lawyers Title | |
| The Irene Rothschild Living Trust | -- | -- | |
| Rothschild Irene | $244,000 | First American Title Co | |
| Federal Home Loan Mortgage Corporation | -- | Benefit Land Title Ins Co | |
| Norwest Mtg Inc | $190,215 | Benefit Land Title Ins Co |
Source: Public Records
Mortgage History
| Date | Status | Borrower | Loan Amount |
|---|---|---|---|
| Open | Cherian Pauli | $394,685 | |
| Previous Owner | Rothschild Irene | $180,000 |
Source: Public Records
Tax History
| Year | Tax Paid | Tax Assessment Tax Assessment Total Assessment is a certain percentage of the fair market value that is determined by local assessors to be the total taxable value of land and additions on the property. | Land | Improvement |
|---|---|---|---|---|
| 2025 | $6,510 | $512,458 | $289,156 | $223,302 |
| 2024 | $6,510 | $502,411 | $283,487 | $218,924 |
| 2023 | $6,391 | $492,561 | $277,929 | $214,632 |
| 2022 | $6,104 | $482,904 | $272,480 | $210,424 |
| 2021 | $6,017 | $473,437 | $267,138 | $206,299 |
| 2019 | $5,843 | $459,396 | $259,215 | $200,181 |
| 2018 | $5,737 | $450,389 | $254,133 | $196,256 |
| 2016 | $5,462 | $432,901 | $244,265 | $188,636 |
| 2015 | $5,385 | $426,399 | $240,596 | $185,803 |
| 2014 | $5,409 | $418,048 | $235,884 | $182,164 |
Source: Public Records
Map
Nearby Homes
- 10020 Mason Ave
- 20323 Kinzie St
- 20604 Lemmer St
- 10037 Sunnybrae Ave
- 20652 Lassen St Unit 5
- 20652 Lassen St Unit 114
- 20656 Septo St
- 20657 Septo St
- 10122 Jovita Ave
- 20200 Lassen St
- 10201 Mason Ave Unit 19
- 20118 Lassen St
- 10211 Casaba Ave
- 9527 Oso Ave
- 20721 Lemarsh St Unit C
- 0 De Soto Unit OC25120663
- 10220 De Soto Ave Unit 11
- 10065 De Soto Ave Unit 304
- 10345 Oso Ave
- 9710 Lubao Ave
- 20445 Lassen St
- 20459 Lassen St
- 20450 Septo St
- 20439 Lassen St
- 20444 Septo St
- 9929 Delco Ave
- 9900 Mason Ave
- 9910 Mason Ave
- 20438 Septo St
- 20431 Lassen St
- 9918 Mason Ave
- 9933 Delco Ave
- 20430 Septo St
- 9924 Mason Ave
- 20450 Lassen St
- 20425 Lassen St
- 20443 Septo St
- 20424 Septo St
- 9937 Delco Ave
- 9932 Mason Ave
Your Personal Tour Guide
Ask me questions while you tour the home.