
Seller's Agent in 2025
Anson Ip
Compass
(408) 221-7887
2 in this area
201 Total Sales
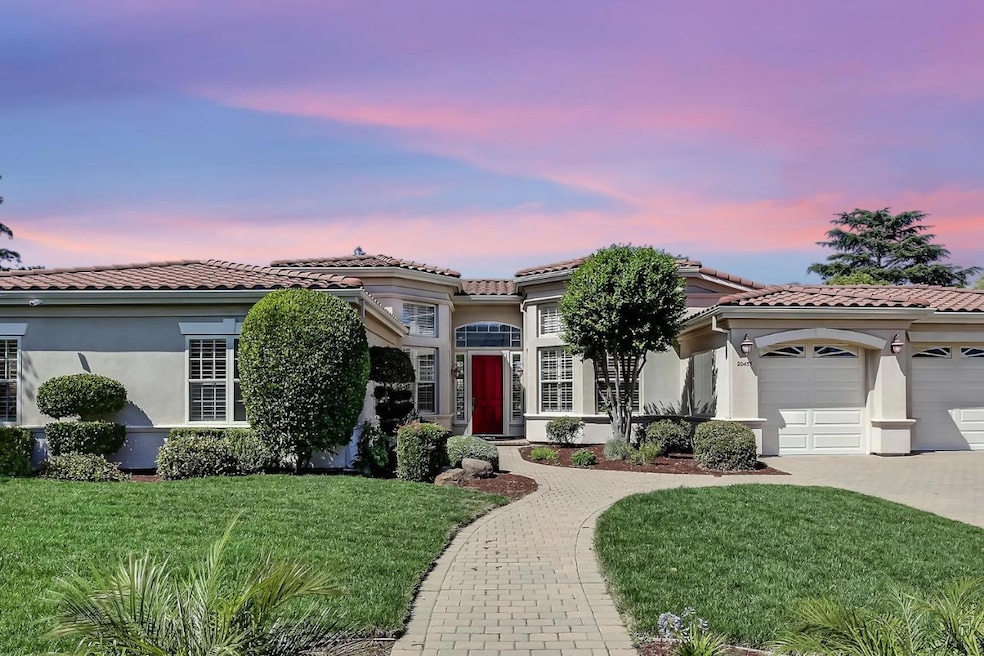


Nestled in Saratogas Golden Triangle, this 2001-built residence blends high ceilings contemporary transitional style. Close to award-winning Argonaut Elem., Redwood Mid., Saratoga High, minutes from Saratoga Country Club, Westgate Center, Saratoga Farmers Market,& Hwy 85. Greeted by the entry door with sidelight, transom window, & turret-style library with built-in bookcases. Inside are windows with plantation shutters & recessed lighting, fireplace with mantle & decorative columns. A turret-style dining area. The kitchen has white cabinetry, granite counters, a dry bar, & premium stainless steel appls: KitchenAid refrigerator, brand new KitchenAid double oven, Miele cooktop, under-cabinet range hood, & LG dishwasher. The family has cozy fireplace, custom cabinetry & direct backyard access. The primary suite has its own backyard access, 2-way fireplace, walk-in closet,& spa-like bath featuring a double sink vanity, frameless walk-in shower, jetted tub & water closet. 3 additional bedrooms, including 1 ensuite with a private bath. A hallway bath with a shower & tub, & powder room, skylight, & built-in desks. A dedicated laundry area, 3-car garage & backyard with 2 waterfalls, swimming pool, raised spa spillover & fire pit. All in one of Silicon Valleys most desirable neighborhood.
| Date | Type | Sale Price | Title Company |
|---|---|---|---|
| Grant Deed | $5,700,000 | First American Title | |
| Grant Deed | $2,261,000 | Fidelity National Title Ins | |
| Grant Deed | $2,050,000 | Stewart Title | |
| Interfamily Deed Transfer | -- | -- | |
| Corporate Deed | $2,290,000 | Old Republic Title Company |
| Date | Status | Loan Amount | Loan Type |
|---|---|---|---|
| Previous Owner | $1,500,000 | No Value Available | |
| Previous Owner | $1,000,000 | No Value Available |
| Date | Event | Price | List to Sale | Price per Sq Ft |
|---|---|---|---|---|
| 09/03/2025 09/03/25 | Sold | $5,700,000 | -1.4% | $1,795 / Sq Ft |
| 08/27/2025 08/27/25 | Pending | -- | -- | -- |
| 08/22/2025 08/22/25 | For Sale | $5,780,000 | -- | $1,820 / Sq Ft |
| Year | Tax Paid | Tax Assessment Tax Assessment Total Assessment is a certain percentage of the fair market value that is determined by local assessors to be the total taxable value of land and additions on the property. | Land | Improvement |
|---|---|---|---|---|
| 2025 | $37,464 | $3,214,662 | $1,706,146 | $1,508,516 |
| 2024 | $37,464 | $3,151,631 | $1,672,693 | $1,478,938 |
| 2023 | $37,149 | $3,089,836 | $1,639,896 | $1,449,940 |
| 2022 | $36,351 | $3,029,252 | $1,607,742 | $1,421,510 |
| 2021 | $35,771 | $2,969,856 | $1,576,218 | $1,393,638 |
| 2020 | $35,032 | $2,939,404 | $1,560,056 | $1,379,348 |
| 2019 | $34,453 | $2,881,769 | $1,529,467 | $1,352,302 |
| 2018 | $33,866 | $2,825,265 | $1,499,478 | $1,325,787 |
| 2017 | $33,755 | $2,769,869 | $1,470,077 | $1,299,792 |
| 2016 | $32,798 | $2,715,558 | $1,441,252 | $1,274,306 |
| 2015 | $32,170 | $2,674,769 | $1,419,604 | $1,255,165 |
| 2014 | $30,608 | $2,546,300 | $1,351,400 | $1,194,900 |
Seller's Agent in 2025
Anson Ip
Compass
(408) 221-7887
2 in this area
201 Total Sales
Buyer's Agent in 2025
Joseph Yen
Compass
(408) 497-2989
2 in this area
99 Total Sales
Source: MLSListings
MLS Number: ML82018960
APN: 393-40-029
Disclaimer: Certain information contained herein is derived from information provided by parties other than Homes.com. All information provided is deemed reliable, but is not guaranteed to be accurate and should be independently verified.
![]() Property Information © 2026 MLSListings Inc. All rights reserved. Listing information is deemed reliable but not guaranteed. Certain information contained herein is derived from information which is the licensed property of, and copyrighted by, MLSListings Inc. The viewer acknowledges ownership and validity of its copyright. Information provided is for personal, non-commercial use by a viewer with a bona fide interest in the purchase or sale of real estate of the type being offered via this website or other electronic means. The viewer is prohibited from copying, redistributing or retransmitting any of the data or information provided by MLSListing, Inc.
Property Information © 2026 MLSListings Inc. All rights reserved. Listing information is deemed reliable but not guaranteed. Certain information contained herein is derived from information which is the licensed property of, and copyrighted by, MLSListings Inc. The viewer acknowledges ownership and validity of its copyright. Information provided is for personal, non-commercial use by a viewer with a bona fide interest in the purchase or sale of real estate of the type being offered via this website or other electronic means. The viewer is prohibited from copying, redistributing or retransmitting any of the data or information provided by MLSListing, Inc.
Ask me questions while you tour the home.