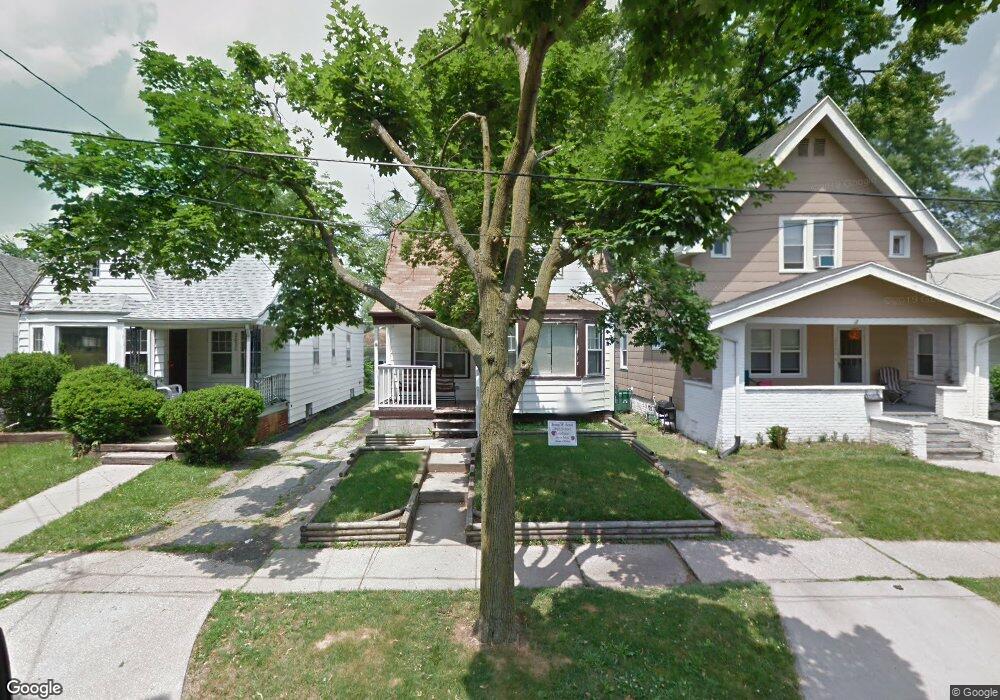
2046 Barrows St Toledo, OH 43613
DeVeaux NeighborhoodEstimated Value: $75,796 - $100,000
3
Beds
1
Bath
1,185
Sq Ft
$71/Sq Ft
Est. Value
About This Home
This home is located at 2046 Barrows St, Toledo, OH 43613 and is currently estimated at $83,699, approximately $70 per square foot. 2046 Barrows St is a home located in Lucas County with nearby schools including DeVeaux Elementary School, Start High School, and Horizon Science Academy - Toledo High School.
Ownership History
Date
Name
Owned For
Owner Type
Purchase Details
Closed on
Jan 6, 2026
Sold by
Brown Tiffin Lee and Taylor Latoya Denise
Bought by
Brown Tiffin Joseph
Current Estimated Value
Purchase Details
Closed on
Oct 26, 2022
Sold by
Centeq Properties Inc
Bought by
Brown Tiffin L and Taylor Latoya D
Purchase Details
Closed on
Sep 10, 2017
Sold by
Na
Bought by
N
Purchase Details
Closed on
Nov 6, 2008
Sold by
Secretary Of Housing & Urban Development
Bought by
Centeq Properties Inc
Purchase Details
Closed on
Oct 17, 2007
Sold by
Yeary Jason
Bought by
Hud
Purchase Details
Closed on
Jul 18, 2002
Sold by
Tina Naveau and Tina Lonnie L
Bought by
Yeary Jason
Home Financials for this Owner
Home Financials are based on the most recent Mortgage that was taken out on this home.
Original Mortgage
$73,841
Interest Rate
6.79%
Mortgage Type
FHA
Purchase Details
Closed on
Mar 26, 1998
Sold by
Borton Stanley D
Bought by
Naveau Lonnie L and Naveau Tina
Create a Home Valuation Report for This Property
The Home Valuation Report is an in-depth analysis detailing your home's value as well as a comparison with similar homes in the area
Home Values in the Area
Average Home Value in this Area
Purchase History
We collect this data history from publicly available records. To have your information removed, we recommend requesting removal directly through your county’s website.
| Date | Buyer | Sale Price | Title Company |
|---|---|---|---|
| Brown Tiffin Joseph | $10,000 | None Listed On Document | |
| Brown Tiffin L | $28,000 | -- | |
| N | -- | None Available | |
| Centeq Properties Inc | $15,000 | None Available | |
| Hud | $70,562 | None Available | |
| Yeary Jason | $75,000 | First Capital | |
| Naveau Lonnie L | $42,500 | A.R.E.A. Title Agency Inc |
Source: Public Records
Mortgage History
We collect this data history from publicly available records. To have your information removed, we recommend requesting removal directly through your county’s website.
| Date | Status | Borrower | Loan Amount |
|---|---|---|---|
| Previous Owner | Yeary Jason | $73,841 |
Source: Public Records
Tax History
| Year | Tax Paid | Tax Assessment Tax Assessment Total Assessment is a certain percentage of the fair market value that is determined by local assessors to be the total taxable value of land and additions on the property. | Land | Improvement |
|---|---|---|---|---|
| 2025 | $1,142 | $16,380 | $5,635 | $10,745 |
| 2024 | $997 | $16,380 | $5,635 | $10,745 |
| 2023 | $922 | $13,825 | $3,675 | $10,150 |
| 2022 | $940 | $13,825 | $3,675 | $10,150 |
| 2021 | $961 | $13,825 | $3,675 | $10,150 |
| 2020 | $1,032 | $13,195 | $3,500 | $9,695 |
| 2019 | $1,008 | $13,195 | $3,500 | $9,695 |
| 2018 | $1,017 | $13,195 | $3,500 | $9,695 |
| 2017 | $1,034 | $12,915 | $3,430 | $9,485 |
| 2016 | $1,034 | $36,900 | $9,800 | $27,100 |
| 2015 | $1,025 | $36,900 | $9,800 | $27,100 |
| 2014 | $835 | $12,920 | $3,430 | $9,490 |
| 2013 | $835 | $12,920 | $3,430 | $9,490 |
Source: Public Records
Map
Nearby Homes
- 3818 Sherbrooke Rd
- 1954 Barrows St
- 2012 Berdan Ave
- 2002 Brame Place
- 2012 Balkan Place
- 2013 Balkan Place
- 2211 W Sylvania Ave
- 2235 Portsmouth Ave
- 1953 Talbot St
- 3711 Sherbrooke Rd
- 4123 Bellevue Rd
- 2133 Loxley Rd
- 1818 Barrows St
- 1810 Brussels St
- 3664 Sherbrooke Rd
- 3835 Matlack Ave
- 1815 Berdan Ave
- 2331 Berdan Ave
- 2306 Eastbrook Dr
- 1750 Berdan Ave
- 2046 Berkshire Place
- 2050 Berkshire Place
- 2042 Berkshire Place
- 2050 Berkshire Place (Ir) 1
- 2052 Berkshire Place
- 2040 Berkshire Place
- 2038 Berkshire Place
- 2047 Brussels St
- 2045 Brussels St
- 2041 Brussels St
- 2053 Brussels St
- 2053 Brussels St
- 2036 Berkshire Place
- 2057 Brussels St
- 2037 Brussels St
- 2034 Berkshire Place
- 2059 Brussels St
- 2047 Berkshire Place
- 2035 Brussels St
- 2049 Berkshire Place
Your Personal Tour Guide
Ask me questions while you tour the home.