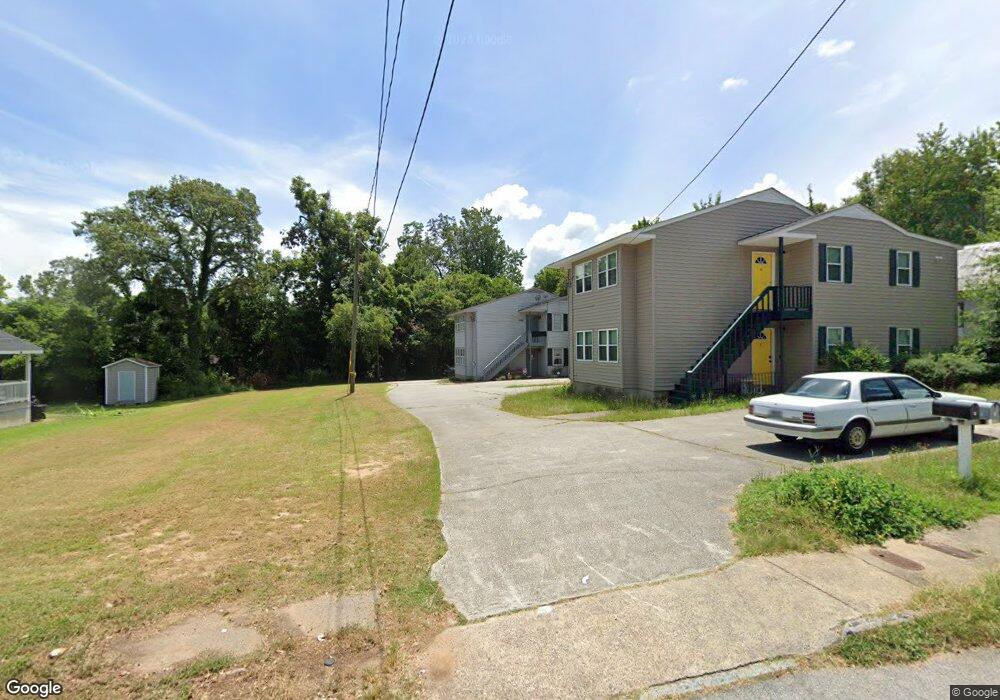
2046 Battle Row Augusta, GA 30904
Harrisburg NeighborhoodEstimated Value: $197,000 - $342,000
4
Beds
2
Baths
1,702
Sq Ft
$155/Sq Ft
Est. Value
About This Home
This home is located at 2046 Battle Row, Augusta, GA 30904 and is currently estimated at $264,573, approximately $155 per square foot. 2046 Battle Row is a home located in Richmond County with nearby schools including R.B. Hunt Elementary School, Lamar Elementary School, and W.S. Hornsby Elementary School.
Ownership History
Date
Name
Owned For
Owner Type
Purchase Details
Closed on
Jul 13, 2021
Sold by
Posh Pads Llc
Bought by
Reese Arijana S
Current Estimated Value
Home Financials for this Owner
Home Financials are based on the most recent Mortgage that was taken out on this home.
Original Mortgage
$189,375
Outstanding Balance
$171,536
Interest Rate
2.93%
Mortgage Type
New Conventional
Estimated Equity
$93,037
Purchase Details
Closed on
Dec 29, 2020
Sold by
Forcier Charles J
Bought by
Umeh Victor
Home Financials for this Owner
Home Financials are based on the most recent Mortgage that was taken out on this home.
Original Mortgage
$82,500
Interest Rate
2.71%
Mortgage Type
New Conventional
Purchase Details
Closed on
Nov 19, 2003
Sold by
Luckey Warren L and Luckey Barbara L
Bought by
Isdell Vicki M and Isdell Richard G
Home Financials for this Owner
Home Financials are based on the most recent Mortgage that was taken out on this home.
Original Mortgage
$70,200
Interest Rate
5.93%
Mortgage Type
Purchase Money Mortgage
Create a Home Valuation Report for This Property
The Home Valuation Report is an in-depth analysis detailing your home's value as well as a comparison with similar homes in the area
Home Values in the Area
Average Home Value in this Area
Purchase History
| Date | Buyer | Sale Price | Title Company |
|---|---|---|---|
| Reese Arijana S | $252,500 | -- | |
| Umeh Victor | $110,000 | -- | |
| Posh Pads Llc | -- | -- | |
| Isdell Vicki M | $78,000 | -- |
Source: Public Records
Mortgage History
| Date | Status | Borrower | Loan Amount |
|---|---|---|---|
| Open | Reese Arijana S | $189,375 | |
| Previous Owner | Umeh Victor | $82,500 | |
| Previous Owner | Isdell Vicki M | $70,200 |
Source: Public Records
Tax History Compared to Growth
Tax History
| Year | Tax Paid | Tax Assessment Tax Assessment Total Assessment is a certain percentage of the fair market value that is determined by local assessors to be the total taxable value of land and additions on the property. | Land | Improvement |
|---|---|---|---|---|
| 2025 | $1,811 | $49,312 | $5,928 | $43,384 |
| 2024 | $1,811 | $44,052 | $5,928 | $38,124 |
| 2023 | $1,912 | $47,616 | $5,928 | $41,688 |
| 2022 | $1,767 | $37,460 | $5,928 | $31,532 |
| 2021 | $1,460 | $24,973 | $2,306 | $22,667 |
| 2020 | $1,364 | $22,506 | $3,960 | $18,546 |
| 2019 | $1,637 | $28,688 | $3,960 | $24,728 |
| 2018 | $1,646 | $28,688 | $3,960 | $24,728 |
| 2017 | $1,640 | $28,688 | $3,960 | $24,728 |
| 2016 | $1,641 | $28,688 | $3,960 | $24,728 |
| 2015 | $1,648 | $28,688 | $3,960 | $24,728 |
| 2014 | $1,587 | $28,688 | $3,960 | $24,728 |
Source: Public Records
Map
Nearby Homes
- 2015 Starnes St
- 2012 Starnes St
- 2008 Starnes St
- 1929 Watkins St
- 542 Hickman Rd
- 1968 Battle Row
- 1940 Starnes St
- 1938 Starnes St
- 1936 Starnes St
- 1934 Starnes St
- 1915 Watkins St
- 729 Heard Ave
- 1924 Fenwick St
- 705 Hickman Rd
- 1943 Heckle St
- 1917 Warren St
- 605 Eve St
- 803 Russell St
- 1916 Walker St
- 1918 Walker St
- 2046 Battle Row
- 2040 Battle Row
- 2048 Battle Row
- 2048 Battle Row Unit D
- 2034 Battle Row
- 2032 Battle Row
- 2050 Battle Row
- 2058 Battle Row
- 2058 Battle Row Unit B
- 2042 Fenwick St
- 2051 Battle Row
- 2045 Battle Row
- 2028 Battle Row
- 2055 Battle Row
- 2062 Battle Row
- 2059 Battle Row
- 2064 Battle Row
- 2045 Fenwick St
- 2063 Battle Row
- 2047 Starnes St