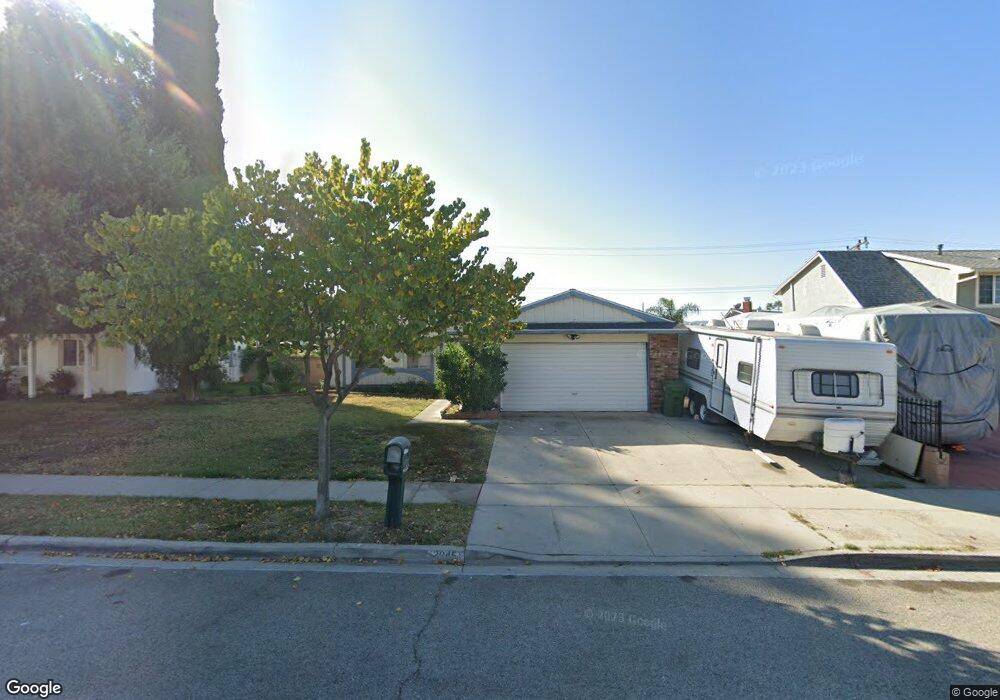
2046 Denny St Simi Valley, CA 93065
Central Simi Valley NeighborhoodEstimated Value: $699,000 - $792,000
3
Beds
2
Baths
1,205
Sq Ft
$617/Sq Ft
Est. Value
About This Home
This home is located at 2046 Denny St, Simi Valley, CA 93065 and is currently estimated at $743,324, approximately $616 per square foot. 2046 Denny St is a home located in Ventura County with nearby schools including Berylwood Elementary School, Hillside Middle School, and Royal High School.
Ownership History
Date
Name
Owned For
Owner Type
Purchase Details
Closed on
Aug 21, 2017
Sold by
Lang Cynthia M
Bought by
Lang Michael A and Lang Cynthia M
Current Estimated Value
Purchase Details
Closed on
Apr 29, 2015
Sold by
Lang Cynthia Marie and Lang Michael Andrew
Bought by
Lang Cynthia M
Home Financials for this Owner
Home Financials are based on the most recent Mortgage that was taken out on this home.
Original Mortgage
$240,000
Outstanding Balance
$184,484
Interest Rate
3.62%
Mortgage Type
New Conventional
Estimated Equity
$558,840
Purchase Details
Closed on
Feb 26, 2015
Sold by
Lang Cynthia Marie
Bought by
Lang Cynthia Marie
Purchase Details
Closed on
Jun 15, 2009
Sold by
Frederick Kent E and Frederick Rosalie
Bought by
Frederick Kent Ellwood and Frederick Rosalie Marie
Purchase Details
Closed on
Jun 12, 1997
Sold by
City Accommodator Inc
Bought by
Frederick Kent E and Frederick Rosalie M
Home Financials for this Owner
Home Financials are based on the most recent Mortgage that was taken out on this home.
Original Mortgage
$124,875
Interest Rate
7.93%
Create a Home Valuation Report for This Property
The Home Valuation Report is an in-depth analysis detailing your home's value as well as a comparison with similar homes in the area
Home Values in the Area
Average Home Value in this Area
Purchase History
| Date | Buyer | Sale Price | Title Company |
|---|---|---|---|
| Lang Michael A | -- | None Available | |
| Lang Cynthia M | -- | First American Title Company | |
| Lang Cynthia Marie | -- | None Available | |
| Frederick Kent Ellwood | -- | None Available | |
| Frederick Kent E | $166,500 | Chicago Title Co | |
| City Accommodator Inc | -- | Chicago Title Co |
Source: Public Records
Mortgage History
| Date | Status | Borrower | Loan Amount |
|---|---|---|---|
| Open | Lang Cynthia M | $240,000 | |
| Closed | Frederick Kent E | $124,875 |
Source: Public Records
Tax History Compared to Growth
Tax History
| Year | Tax Paid | Tax Assessment Tax Assessment Total Assessment is a certain percentage of the fair market value that is determined by local assessors to be the total taxable value of land and additions on the property. | Land | Improvement |
|---|---|---|---|---|
| 2025 | $3,642 | $265,825 | $106,325 | $159,500 |
| 2024 | $3,642 | $260,613 | $104,240 | $156,373 |
| 2023 | $3,422 | $255,503 | $102,196 | $153,307 |
| 2022 | $3,389 | $250,494 | $100,193 | $150,301 |
| 2021 | $3,346 | $245,583 | $98,229 | $147,354 |
| 2020 | $3,264 | $243,067 | $97,223 | $145,844 |
| 2019 | $3,114 | $238,302 | $95,317 | $142,985 |
| 2018 | $3,076 | $233,631 | $93,449 | $140,182 |
| 2017 | $2,998 | $229,051 | $91,617 | $137,434 |
| 2016 | $2,860 | $224,561 | $89,821 | $134,740 |
| 2015 | $2,791 | $221,190 | $88,473 | $132,717 |
| 2014 | -- | $216,858 | $86,740 | $130,118 |
Source: Public Records
Map
Nearby Homes
- 1948 Heywood St Unit L
- 1932 Heywood St Unit B
- 2095 Morley St
- 2241 Burnside St
- 2146 N Brower St
- 2091 Marter Ave
- 1755 Heywood St Unit 203
- 1886 Cloud Ct
- 1740 Heywood St
- 2368 Heywood St
- 1882 Larch St
- 2405 Lee St
- 2239 McDonald St
- 2349 Knollhaven St
- 2025 Royal Ave
- 2266 Lansdale Ct
- 1858 Sutter Ave
- 1290 Lawrence Cir
- 1277 Erringer Rd
- 2291 N Marter Ct