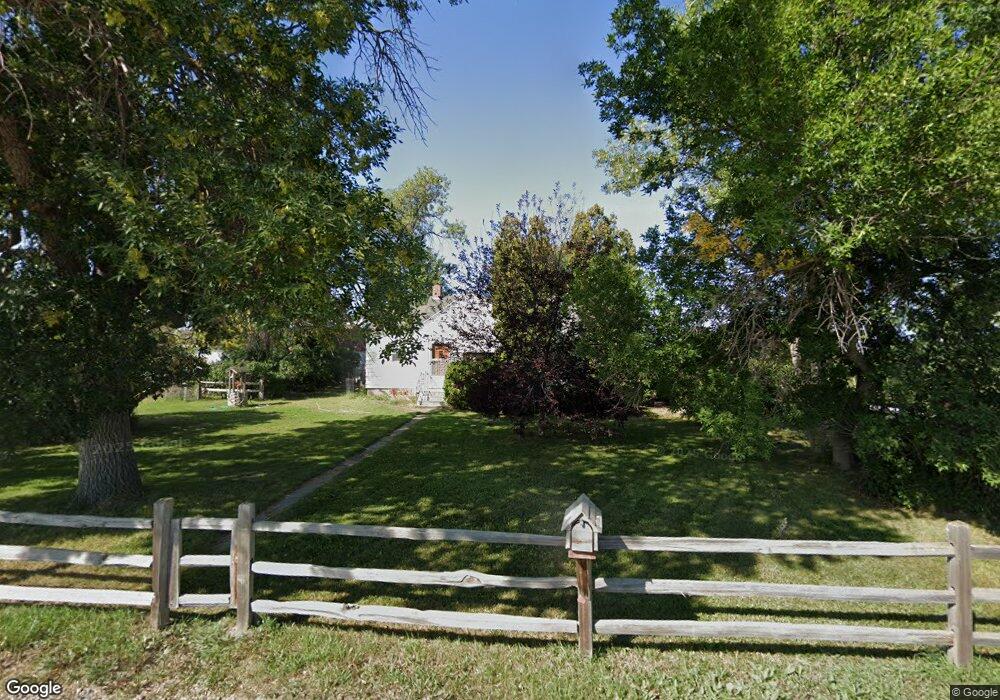
2046 S 11th Rd Ballantine, MT 59006
Estimated Value: $351,132 - $628,000
2
Beds
1
Bath
1,232
Sq Ft
$363/Sq Ft
Est. Value
About This Home
This home is located at 2046 S 11th Rd, Ballantine, MT 59006 and is currently estimated at $446,783, approximately $362 per square foot. 2046 S 11th Rd is a home located in Yellowstone County with nearby schools including Huntley Project Elementary School, Huntley Project Junior High School, and Huntley Project High School.
Ownership History
Date
Name
Owned For
Owner Type
Purchase Details
Closed on
May 12, 2006
Sold by
Karell Betty L
Bought by
Ward Marla R
Current Estimated Value
Home Financials for this Owner
Home Financials are based on the most recent Mortgage that was taken out on this home.
Original Mortgage
$92,800
Outstanding Balance
$53,438
Interest Rate
6.3%
Mortgage Type
New Conventional
Estimated Equity
$393,345
Create a Home Valuation Report for This Property
The Home Valuation Report is an in-depth analysis detailing your home's value as well as a comparison with similar homes in the area
Purchase History
| Date | Buyer | Sale Price | Title Company |
|---|---|---|---|
| Ward Marla R | -- | None Available |
Source: Public Records
Mortgage History
| Date | Status | Borrower | Loan Amount |
|---|---|---|---|
| Open | Ward Marla R | $92,800 |
Source: Public Records
Tax History
| Year | Tax Paid | Tax Assessment Tax Assessment Total Assessment is a certain percentage of the fair market value that is determined by local assessors to be the total taxable value of land and additions on the property. | Land | Improvement |
|---|---|---|---|---|
| 2025 | $1,707 | $354,400 | $72,147 | $282,253 |
| 2024 | $1,707 | $272,800 | $57,759 | $215,041 |
| 2023 | $2,064 | $272,800 | $57,759 | $215,041 |
| 2022 | $1,404 | $185,500 | $0 | $0 |
| 2021 | $1,530 | $185,500 | $0 | $0 |
| 2020 | $1,356 | $160,300 | $0 | $0 |
| 2019 | $1,322 | $160,300 | $0 | $0 |
| 2018 | $1,456 | $167,100 | $0 | $0 |
| 2017 | $1,433 | $167,100 | $0 | $0 |
| 2016 | $1,272 | $162,600 | $0 | $0 |
| 2015 | $1,366 | $162,600 | $0 | $0 |
| 2014 | $1,186 | $74,147 | $0 | $0 |
Source: Public Records
Map
Nearby Homes
- 1225 Homestead Dr
- 2285 N 9th Rd
- 2293 N 12th Rd
- 2573 Road 8
- 2466 2nd St
- 2621 N 13th Rd
- 2578 N 14th Rd
- 2573 N 8th Rd
- 2489 2nd St
- 2485 2nd St
- 2483 2nd St
- 2491 2nd St
- 10052 Floating Island Way
- 2480 E I Rd
- 2062 E I Rd
- Lot 3 Pryor Creek Rd
- 8700 Fox Run
- 7420 Whitetail Run
- 7340 Wild Game Trail
- 7290 Whitetail Run
Your Personal Tour Guide
Ask me questions while you tour the home.