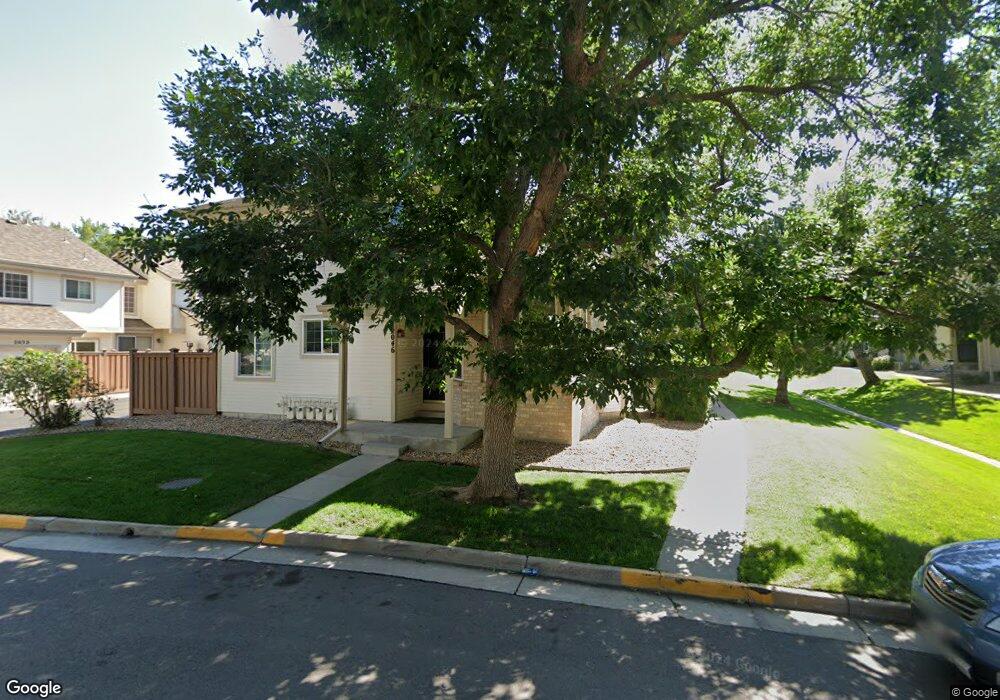
2046 S Xenia Way Unit 55 Denver, CO 80231
Indian Creek NeighborhoodEstimated Value: $411,000 - $423,000
3
Beds
4
Baths
1,441
Sq Ft
$289/Sq Ft
Est. Value
About This Home
This home is located at 2046 S Xenia Way Unit 55, Denver, CO 80231 and is currently estimated at $416,350, approximately $288 per square foot. 2046 S Xenia Way Unit 55 is a home located in Arapahoe County with nearby schools including Eastridge Community Elementary School, Prairie Middle School, and Overland High School.
Ownership History
Date
Name
Owned For
Owner Type
Purchase Details
Closed on
Jul 26, 1995
Sold by
Barrows Susan Miller
Bought by
Kiehm Jeffrey E
Current Estimated Value
Home Financials for this Owner
Home Financials are based on the most recent Mortgage that was taken out on this home.
Original Mortgage
$123,500
Interest Rate
7.49%
Mortgage Type
FHA
Purchase Details
Closed on
Jun 26, 1992
Sold by
Risteen Andrew J Risteen Paige E
Bought by
Barrows Susan Miller
Purchase Details
Closed on
Feb 8, 1989
Sold by
Colorado R E S Inc
Bought by
Risteen Andrew J Risteen Paige E
Purchase Details
Closed on
Nov 2, 1988
Sold by
Willows At Highline Ltd
Bought by
Colorado R E S Inc
Purchase Details
Closed on
Dec 31, 1987
Sold by
Conversion Arapco
Bought by
Willows At Highline Ltd
Purchase Details
Closed on
Jan 21, 1987
Bought by
Conversion Arapco
Create a Home Valuation Report for This Property
The Home Valuation Report is an in-depth analysis detailing your home's value as well as a comparison with similar homes in the area
Home Values in the Area
Average Home Value in this Area
Purchase History
| Date | Buyer | Sale Price | Title Company |
|---|---|---|---|
| Kiehm Jeffrey E | $129,900 | First American Heritage Titl | |
| Barrows Susan Miller | -- | -- | |
| Risteen Andrew J Risteen Paige E | -- | -- | |
| Colorado R E S Inc | -- | -- | |
| Willows At Highline Ltd | -- | -- | |
| Conversion Arapco | -- | -- |
Source: Public Records
Mortgage History
| Date | Status | Borrower | Loan Amount |
|---|---|---|---|
| Closed | Kiehm Jeffrey E | $123,500 |
Source: Public Records
Tax History Compared to Growth
Tax History
| Year | Tax Paid | Tax Assessment Tax Assessment Total Assessment is a certain percentage of the fair market value that is determined by local assessors to be the total taxable value of land and additions on the property. | Land | Improvement |
|---|---|---|---|---|
| 2024 | $2,353 | $27,979 | -- | -- |
| 2023 | $2,353 | $27,979 | $0 | $0 |
| 2022 | $1,973 | $22,157 | $0 | $0 |
| 2021 | $1,984 | $22,157 | $0 | $0 |
| 2020 | $2,089 | $23,802 | $0 | $0 |
| 2019 | $2,013 | $23,802 | $0 | $0 |
| 2018 | $1,944 | $20,484 | $0 | $0 |
| 2017 | $1,920 | $20,484 | $0 | $0 |
| 2016 | $1,693 | $17,058 | $0 | $0 |
| 2015 | $1,629 | $17,058 | $0 | $0 |
| 2014 | -- | $13,747 | $0 | $0 |
| 2013 | -- | $14,780 | $0 | $0 |
Source: Public Records
Map
Nearby Homes
- 1885 S Quebec Way Unit B23
- 1885 S Quebec Way Unit G106
- 1885 S Quebec Way Unit D22
- 1885 S Quebec Way Unit G104
- 1885 S Quebec Way Unit B22
- 2295 S Beeler Way
- 2294 S Dallas Ct
- 1811 S Quebec Way Unit 151
- 1811 S Quebec Way Unit 82
- 1811 S Quebec Way Unit 95
- 1811 S Quebec Way Unit 31
- 1818 S Quebec Way Unit 6
- 1818 S Quebec Way Unit 4-6
- 1818 S Quebec Way Unit 4
- 1722 S Beeler Ct
- 9126 E Wesley Ave
- 9400 E Iliff Ave Unit 332
- 9400 E Iliff Ave Unit 125
- 9400 E Iliff Ave Unit 134
- 9400 E Iliff Ave Unit 145
- 2048 S Xenia Way Unit 56
- 2050 S Xenia Way Unit 57
- 2052 S Xenia Way
- 2032 S Xenia Way Unit 44
- 2034 S Xenia Way Unit 45
- 2045 S Xenia Way
- 2054 S Xenia Way Unit 205459
- 2036 S Xenia Way
- 2030 S Xenia Way Unit 43
- 2064 S Xenia Way Unit 68
- 2038 S Xenia Way Unit 47
- 2066 S Xenia Way
- 2047 S Xenia Way Unit 53
- 2056 S Xenia Way Unit 60
- 2061 S Xenia Way Unit 66
- 2068 S Xenia Way Unit 70
- 2029 S Xenia Way
- 2063 S Xenia Way
- 2049 S Xenia Way
- 2070 S Xenia Way