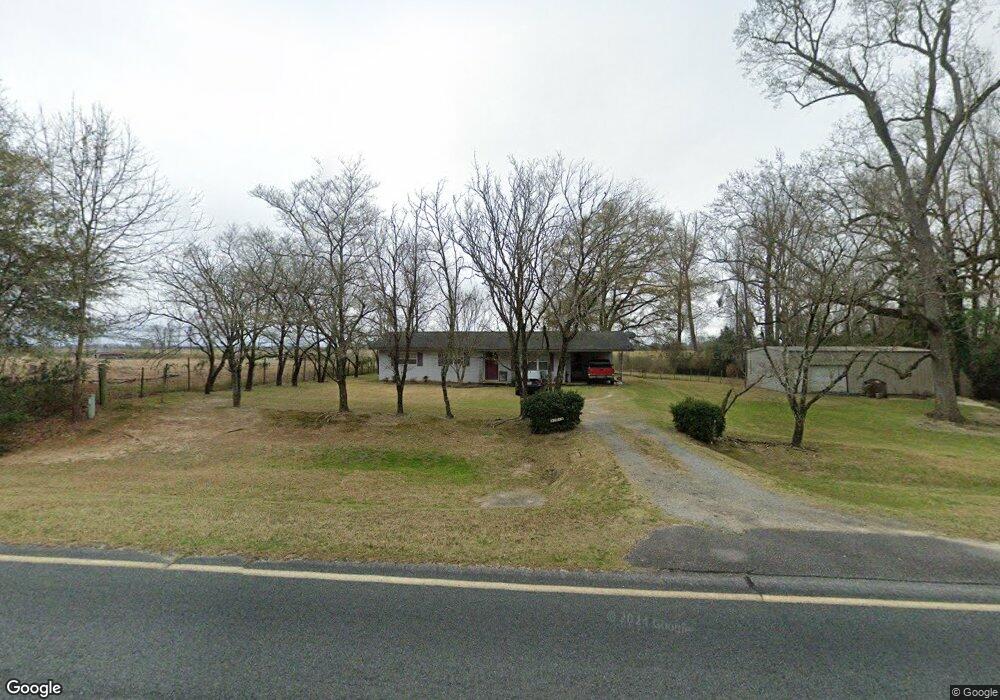
2046 Soperton Hwy Eastman, GA 31023
Estimated Value: $120,000 - $208,000
--
Bed
2
Baths
1,248
Sq Ft
$122/Sq Ft
Est. Value
About This Home
This home is located at 2046 Soperton Hwy, Eastman, GA 31023 and is currently estimated at $152,712, approximately $122 per square foot. 2046 Soperton Hwy is a home located in Dodge County with nearby schools including Dodge County High School.
Ownership History
Date
Name
Owned For
Owner Type
Purchase Details
Closed on
Jul 28, 2008
Sold by
Josehp C Graham
Bought by
Graham Joan L
Current Estimated Value
Create a Home Valuation Report for This Property
The Home Valuation Report is an in-depth analysis detailing your home's value as well as a comparison with similar homes in the area
Home Values in the Area
Average Home Value in this Area
Purchase History
| Date | Buyer | Sale Price | Title Company |
|---|---|---|---|
| Graham Joan L | -- | -- |
Source: Public Records
Tax History Compared to Growth
Tax History
| Year | Tax Paid | Tax Assessment Tax Assessment Total Assessment is a certain percentage of the fair market value that is determined by local assessors to be the total taxable value of land and additions on the property. | Land | Improvement |
|---|---|---|---|---|
| 2024 | $889 | $36,175 | $2,834 | $33,341 |
| 2023 | $421 | $36,175 | $2,834 | $33,341 |
| 2022 | $812 | $33,530 | $2,178 | $31,352 |
| 2021 | $791 | $32,625 | $2,178 | $30,447 |
| 2020 | $795 | $32,314 | $1,867 | $30,447 |
| 2019 | $731 | $29,532 | $1,867 | $27,665 |
| 2018 | $775 | $30,309 | $1,867 | $28,442 |
| 2017 | $755 | $29,532 | $1,867 | $27,665 |
| 2016 | $639 | $26,999 | $1,867 | $25,132 |
| 2015 | -- | $26,999 | $1,867 | $25,132 |
| 2014 | -- | $26,999 | $1,867 | $25,132 |
| 2013 | -- | $26,999 | $1,867 | $25,132 |
Source: Public Records
Map
Nearby Homes
- 6515 Fred Bohannon Rd
- LOT 5 Bowen Dr
- 0 Shady Oaks Rd Unit 10400925
- 0 Shady Oaks Rd Unit 246471
- 534 Soperton Hwy
- 0 Jim Pruett Rd Unit 25211863
- 0 Jim Pruett Rd Unit 10540625
- 0 Windy Way
- 0 Forest Ave Unit 10588959
- 5559 Bacon Ave
- 5533 Russell Ave
- 0 Williams Dr Unit 10632909
- 5616 Beulah Ave
- 5811 5th Ave
- 5422 1st Ave
- 220 Page St
- 5859 8th Ave
- 5218 4th Ave
- 1348 Minter Ridge
- 0 Smith Rd
- 2094 Soperton Hwy
- 2031 Soperton Hwy
- 1878 Soperton Hwy
- 26 Long Leaf Dr
- 15 Long Leaf Dr
- 27 Long Leaf Dr
- 2160 Soperton Hwy
- 166 Granny Branch Rd
- 2185 Soperton Hwy
- 0 Fountain Rd Unit 121,122 7196165
- 0 Fountain Rd
- 0 Fountain Rd Unit 7462486
- 0 Fountain Rd Unit 7400229
- 0 Fountain Rd Unit 7182482
- 0 Fountain Rd Unit 3174091
- 91 Long Leaf Dr
- 1840 Soperton Hwy
- 161 Long Leaf Dr
- 89 Long Leaf Dr
- 1692 Soperton Hwy