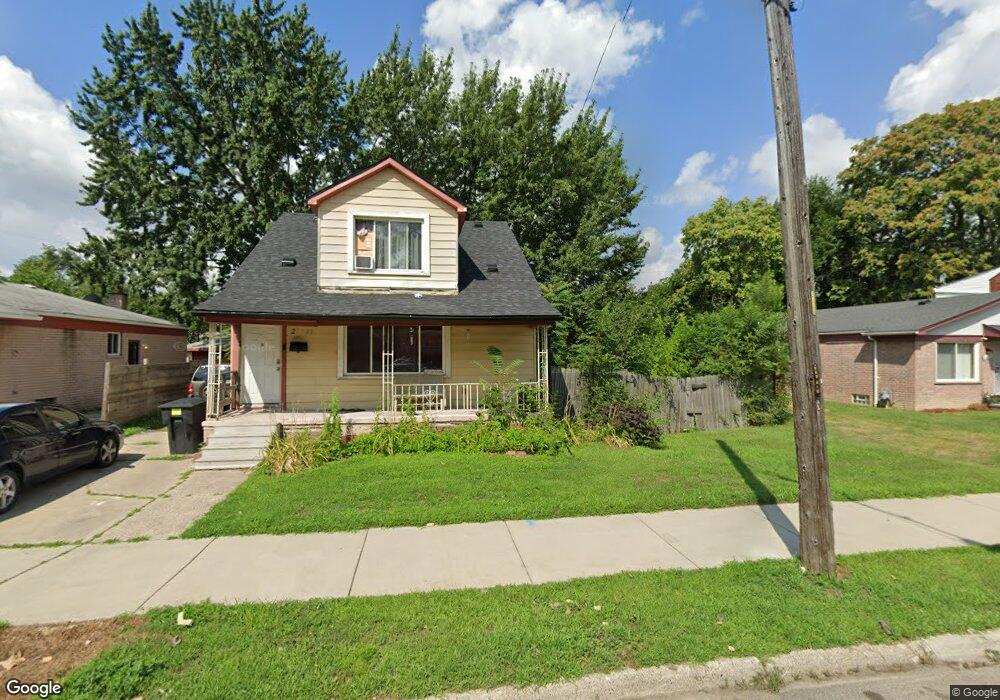
20467 Kentucky St Unit Bldg-Unit Detroit, MI 48221
Garden Homes NeighborhoodEstimated Value: $116,000 - $160,000
--
Bed
1
Bath
1,535
Sq Ft
$91/Sq Ft
Est. Value
About This Home
This home is located at 20467 Kentucky St Unit Bldg-Unit, Detroit, MI 48221 and is currently estimated at $139,313, approximately $90 per square foot. 20467 Kentucky St Unit Bldg-Unit is a home located in Wayne County with nearby schools including Pasteur Elementary School, Charles L. Spain Elementary-Middle School, and Edward 'Duke' Ellington Conservatory of Music and Art.
Ownership History
Date
Name
Owned For
Owner Type
Purchase Details
Closed on
Dec 10, 2024
Sold by
Seward Veronica
Bought by
House To Home Llc
Current Estimated Value
Purchase Details
Closed on
Jul 19, 2017
Sold by
Lemon Desiree and Seward Veronica
Bought by
Seward Veronica
Purchase Details
Closed on
May 19, 2014
Sold by
Lemon Desiree
Bought by
Lemon Desiree
Purchase Details
Closed on
May 8, 2014
Sold by
Fannie Mae
Bought by
Lemon Desiree
Purchase Details
Closed on
Apr 10, 2013
Sold by
Jpmorgan Chase Bank National Association
Bought by
Fannie Mae and Federal National Mortgage Association
Purchase Details
Closed on
Mar 14, 2013
Sold by
Jackson James
Bought by
Jpmorgan Chase Bank National Association
Create a Home Valuation Report for This Property
The Home Valuation Report is an in-depth analysis detailing your home's value as well as a comparison with similar homes in the area
Home Values in the Area
Average Home Value in this Area
Purchase History
| Date | Buyer | Sale Price | Title Company |
|---|---|---|---|
| House To Home Llc | -- | None Listed On Document | |
| House To Home Llc | -- | None Listed On Document | |
| House To Home Llc | -- | None Listed On Document | |
| Seward Veronica | -- | None Available | |
| Lemon Desiree | -- | None Available | |
| Lemon Desiree | $802,600 | Attorneys Title Agency Llc | |
| Fannie Mae | -- | None Available | |
| Jpmorgan Chase Bank National Association | $79,348 | None Available |
Source: Public Records
Tax History Compared to Growth
Tax History
| Year | Tax Paid | Tax Assessment Tax Assessment Total Assessment is a certain percentage of the fair market value that is determined by local assessors to be the total taxable value of land and additions on the property. | Land | Improvement |
|---|---|---|---|---|
| 2025 | $1,422 | $51,900 | $0 | $0 |
| 2024 | $1,422 | $44,400 | $0 | $0 |
| 2023 | $1,220 | $34,500 | $0 | $0 |
| 2022 | $1,310 | $26,500 | $0 | $0 |
| 2021 | $251 | $0 | $0 | $0 |
| 2020 | $1,289 | $20,100 | $0 | $0 |
| 2019 | $1,269 | $16,500 | $0 | $0 |
| 2018 | $1,081 | $14,500 | $0 | $0 |
| 2017 | $266 | $14,000 | $0 | $0 |
| 2016 | $1,266 | $24,800 | $0 | $0 |
| 2015 | $1,710 | $17,100 | $0 | $0 |
| 2013 | $1,734 | $24,054 | $0 | $0 |
| 2010 | -- | $31,898 | $1,199 | $30,699 |
Source: Public Records
Map
Nearby Homes
- 20451 Kentucky St
- 20436 Washburn St
- 20401 Washburn St
- 20484 Wisconsin St
- 20145 Kentucky St
- 20043 Wyoming Ave
- 20134 Griggs St
- 20504 Cherrylawn St
- 21032 Woodside Ave
- 20501 Northlawn St
- 20515 Mendota St
- 21040 Woodside Ave
- 20885 Westview Ave
- 19958 Washburn St
- 20145 Northlawn St
- 20030 Ohio St
- 21056 Woodside Ave
- 19936 Washburn St
- 20805 Bethlawn Blvd
- 20436 Monte Vista St
- 20467 Kentucky St
- 20477 Kentucky St
- 20466 Wyoming St
- 20484 Wyoming St
- 20450 Wyoming St
- 20483 Kentucky St
- 20493 Kentucky St
- 20442 Wyoming St
- 20500 Wyoming St
- 20445 Kentucky St
- 20437 Kentucky St
- 20520 Wyoming St
- 20501 Kentucky St
- 20434 Wyoming St
- 20505 Kentucky St
- 20454 Kentucky St
- 20428 Wyoming St
- 20475 Wyoming St
- 20463 Wyoming St
- 20428 Wyoming Ave