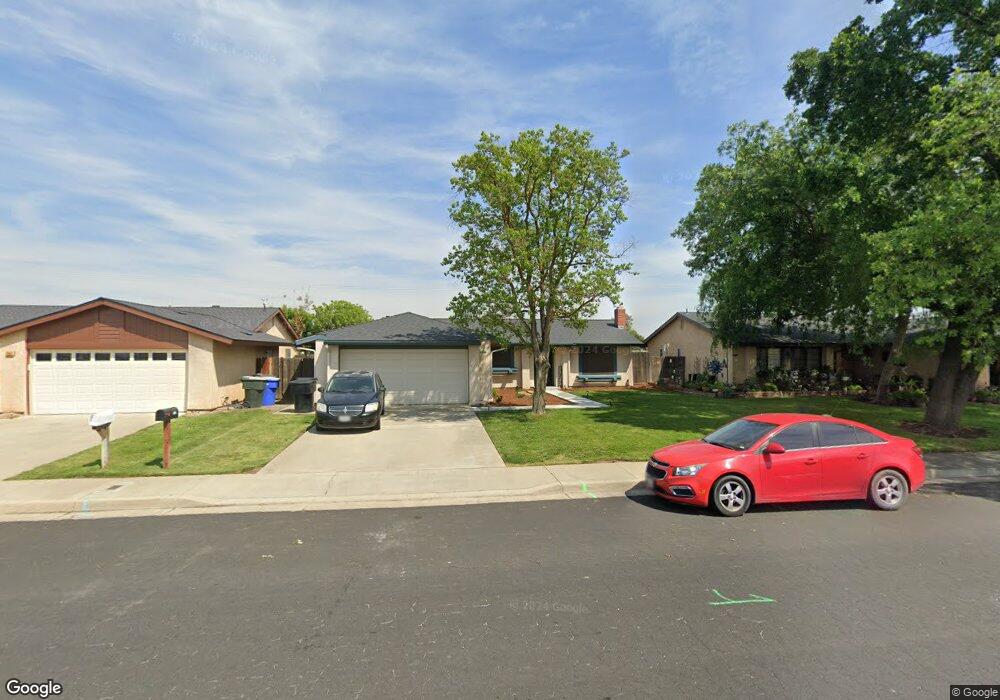
2047 Harrison Ave Hanford, CA 93230
Estimated Value: $302,000 - $325,000
3
Beds
2
Baths
1,092
Sq Ft
$283/Sq Ft
Est. Value
About This Home
This home is located at 2047 Harrison Ave, Hanford, CA 93230 and is currently estimated at $308,783, approximately $282 per square foot. 2047 Harrison Ave is a home located in Kings County with nearby schools including Hamilton Elementary School, John F. Kennedy Junior High School, and Hanford High School.
Ownership History
Date
Name
Owned For
Owner Type
Purchase Details
Closed on
Jul 15, 2024
Sold by
Stalker Donald Todd and Stalker Kimberly Lynn
Bought by
Donald Todd Stalker And Kimberly Lynn Stalker and Stalker
Current Estimated Value
Purchase Details
Closed on
Apr 10, 2024
Sold by
Standridge Kimberly L and Stalker Donald Todd
Bought by
Stalker Donald Todd and Stalker Kimberly Lynn
Purchase Details
Closed on
Apr 9, 2024
Sold by
Standridge Kimberly L and Stalker Donald Todd
Bought by
Stalker Donald Todd and Stalker Kimberly Lynn
Purchase Details
Closed on
Nov 19, 2003
Sold by
Standridge Kimberly L
Bought by
Standridge Kimberly L
Home Financials for this Owner
Home Financials are based on the most recent Mortgage that was taken out on this home.
Original Mortgage
$85,622
Interest Rate
5.89%
Mortgage Type
FHA
Purchase Details
Closed on
Nov 8, 1999
Sold by
Standridge James J and Standridge Kimberly L
Bought by
Standridge Kimberly L
Create a Home Valuation Report for This Property
The Home Valuation Report is an in-depth analysis detailing your home's value as well as a comparison with similar homes in the area
Home Values in the Area
Average Home Value in this Area
Purchase History
| Date | Buyer | Sale Price | Title Company |
|---|---|---|---|
| Donald Todd Stalker And Kimberly Lynn Stalker | -- | None Listed On Document | |
| Stalker Donald Todd | -- | None Listed On Document | |
| Stalker Donald Todd | -- | None Listed On Document | |
| Standridge Kimberly L | -- | Chicago Title Company | |
| Standridge Kimberly L | -- | -- |
Source: Public Records
Mortgage History
| Date | Status | Borrower | Loan Amount |
|---|---|---|---|
| Previous Owner | Standridge Kimberly L | $85,622 |
Source: Public Records
Tax History Compared to Growth
Tax History
| Year | Tax Paid | Tax Assessment Tax Assessment Total Assessment is a certain percentage of the fair market value that is determined by local assessors to be the total taxable value of land and additions on the property. | Land | Improvement |
|---|---|---|---|---|
| 2025 | $1,587 | $149,514 | $49,838 | $99,676 |
| 2023 | $1,587 | $143,709 | $47,903 | $95,806 |
| 2022 | $1,554 | $140,892 | $46,964 | $93,928 |
| 2021 | $1,520 | $138,131 | $46,044 | $92,087 |
| 2020 | $1,536 | $136,715 | $45,572 | $91,143 |
| 2019 | $1,511 | $134,034 | $44,678 | $89,356 |
| 2018 | $1,467 | $131,406 | $43,802 | $87,604 |
| 2017 | $1,445 | $128,829 | $42,943 | $85,886 |
| 2016 | $1,426 | $126,303 | $42,101 | $84,202 |
| 2015 | $1,417 | $124,406 | $41,469 | $82,937 |
| 2014 | $1,390 | $121,969 | $40,657 | $81,312 |
Source: Public Records
Map
Nearby Homes
- 956 Clover Ln
- 920 Moffat Dr
- 1028 Hayes Way
- 2123 Cottonwood Ct
- 2024 Neill Way
- 2202 Cottonwood Ct
- 841 Moffat Dr
- 860 E Grangeville Blvd
- 860 E Grangeville Blvd Unit 98
- 860 E Grangeville Blvd Unit 117
- 860 E Grangeville Blvd Unit 23
- 860 E Grangeville Blvd Unit 166
- 860 E Grangeville Blvd Unit 11
- 852 E Grangeville Blvd Unit 6
- 852 E Grangeville Blvd Unit 98
- 1807 Hardcastle Ave
- 1249 Levich St
- 98379 9 1 4 Ave
- 2411 Cottonwood Dr
- 2051 Harrison Ave
- 2031 Harrison Ave
- 2059 Harrison Ave
- 1096 Moffat Dr
- 1095 Salem Dr
- 2023 Harrison Ave
- 2063 Harrison Ave
- 1074 Moffat Dr
- 1073 Salem Dr
- 1093 Moffat Dr
- 2071 Harrison Ave
- 2011 Harrison Ave
- 1060 Moffat Dr
- 1071 Moffat Dr
- 1065 Salem Dr
- 2079 Harrison Ave
- 1098 Salem Dr
- 2003 Harrison Ave
- 1067 Moffat Dr
- 1054 Moffat Dr