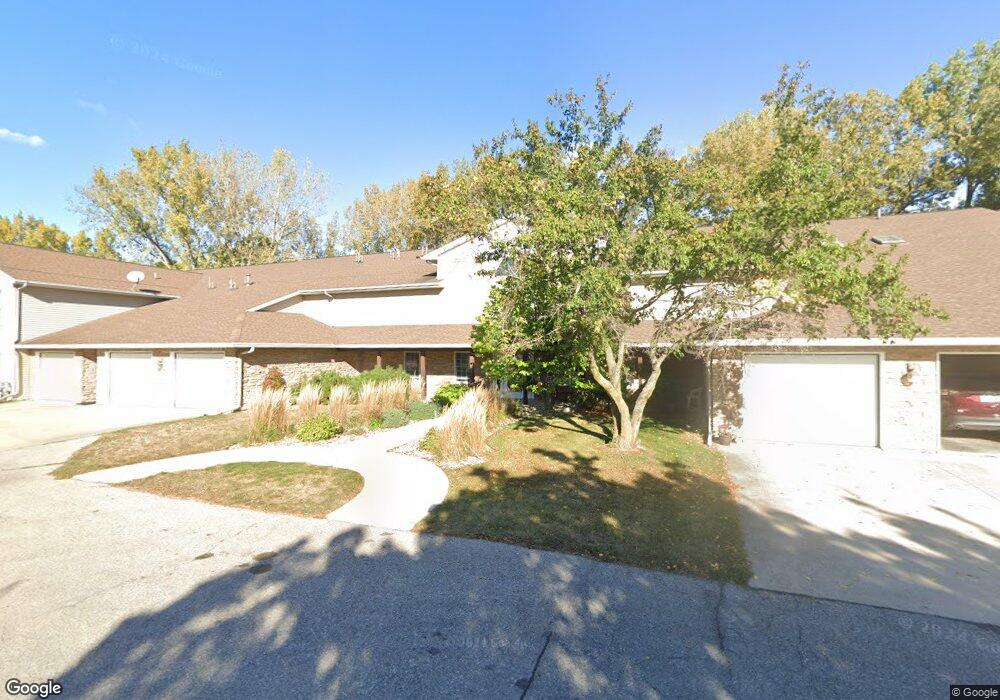
2047 Hunters Ridge Dr Mason City, IA 50401
Estimated Value: $232,786 - $267,000
2
Beds
2
Baths
1,548
Sq Ft
$160/Sq Ft
Est. Value
About This Home
This home is located at 2047 Hunters Ridge Dr, Mason City, IA 50401 and is currently estimated at $247,947, approximately $160 per square foot. 2047 Hunters Ridge Dr is a home located in Cerro Gordo County with nearby schools including Mason City High School, Newman Catholic School, and Newman Catholic Elementary School.
Ownership History
Date
Name
Owned For
Owner Type
Purchase Details
Closed on
May 23, 2025
Sold by
Kopal Edwina H
Bought by
Ackerman Dwight Darryll and Ackerman Rebecca S
Current Estimated Value
Home Financials for this Owner
Home Financials are based on the most recent Mortgage that was taken out on this home.
Original Mortgage
$126,500
Outstanding Balance
$119,340
Interest Rate
6.83%
Mortgage Type
New Conventional
Estimated Equity
$128,607
Purchase Details
Closed on
Feb 1, 2024
Sold by
Yezek Valorie D and Gunderson Corliss H
Bought by
Kopal Edwina H
Purchase Details
Closed on
Sep 14, 2011
Sold by
Kuhlemeier Dayle R and Kuhlemeier Janet L
Bought by
Yezek Valorie D and Kuhlemeier Janet L
Purchase Details
Closed on
Oct 29, 2008
Sold by
Kollman Larry L
Bought by
Kuhlemeier Dayle R and Kuhlemeier Janet L
Create a Home Valuation Report for This Property
The Home Valuation Report is an in-depth analysis detailing your home's value as well as a comparison with similar homes in the area
Home Values in the Area
Average Home Value in this Area
Purchase History
| Date | Buyer | Sale Price | Title Company |
|---|---|---|---|
| Ackerman Dwight Darryll | $250,000 | None Listed On Document | |
| Kopal Edwina H | -- | None Listed On Document | |
| Yezek Valorie D | $155,000 | None Available | |
| Kuhlemeier Dayle R | $170,000 | None Available |
Source: Public Records
Mortgage History
| Date | Status | Borrower | Loan Amount |
|---|---|---|---|
| Open | Ackerman Dwight Darryll | $126,500 |
Source: Public Records
Tax History Compared to Growth
Tax History
| Year | Tax Paid | Tax Assessment Tax Assessment Total Assessment is a certain percentage of the fair market value that is determined by local assessors to be the total taxable value of land and additions on the property. | Land | Improvement |
|---|---|---|---|---|
| 2024 | $2,712 | $201,700 | $38,500 | $163,200 |
| 2023 | $3,348 | $201,700 | $38,500 | $163,200 |
| 2022 | $3,384 | $181,380 | $29,620 | $151,760 |
| 2021 | $3,126 | $177,890 | $29,620 | $148,270 |
| 2020 | $3,313 | $156,110 | $29,620 | $126,490 |
| 2019 | $2,842 | $0 | $0 | $0 |
| 2018 | $2,850 | $0 | $0 | $0 |
| 2017 | $2,926 | $0 | $0 | $0 |
| 2016 | $2,846 | $0 | $0 | $0 |
| 2015 | $2,846 | $0 | $0 | $0 |
| 2014 | $2,976 | $0 | $0 | $0 |
| 2013 | $2,858 | $0 | $0 | $0 |
Source: Public Records
Map
Nearby Homes
- 34 Winnebago Ct
- 2004 Hunters Ridge Dr
- 2042 Hunters Ridge Dr
- 1713 4th St SW
- 60 Timber Creek Dr
- 155 Timber Creek Dr
- 5 Lakeview Dr
- 2262 W State St
- 125 Pebble Creek Dr
- 600 Briarstone Dr Unit A-3
- 80 Pebble Creek Dr
- 660 Briarstone Dr
- 78 Lakeview Dr
- 667 Briarstone Dr Unit 1, Garage 7
- L1 Blk1 & Blk 2 Pebble Creek 2nd Sub
- 149 Parkridge Dr
- L 1 BLK 1 Pebble Creek 1st Sub
- 740 Briarstone Dr
- 1622 7th Place SW
- 1645 7th Place SW
- 2047 Hunters Ridge Dr
- 2047 Hunters Ridge Dr
- 2047 Hunters Ridge Dr
- 2047 Hunters Ridge Dr
- 2047 Hunters Ridge Dr
- 2047 Hunters Ridge Dr
- 2047 Hunters Ridge Dr
- 2047 Hunters Ridge Dr
- 2047 Hunters Ridge Dr
- 2047 Hunters Ridge Dr
- 2047 Hunters Ridge Dr
- 2047 Hunters Ridge Dr Unit 107
- 2047 Hunters Ridge Dr
- 2047 Hunters Ridge Dr Unit 207
- 2047 Hunters Ridge Dr Unit 211
- 2047 Hunters Ridge Dr Unit 111
- 2047 Hunters Ridge Dr Unit 206
- 2047 Hunters Ridge Dr Unit 109
- 2047 Hunters Ridge Dr Unit 207
- 2047 Hunters Ridge Dr Unit 208