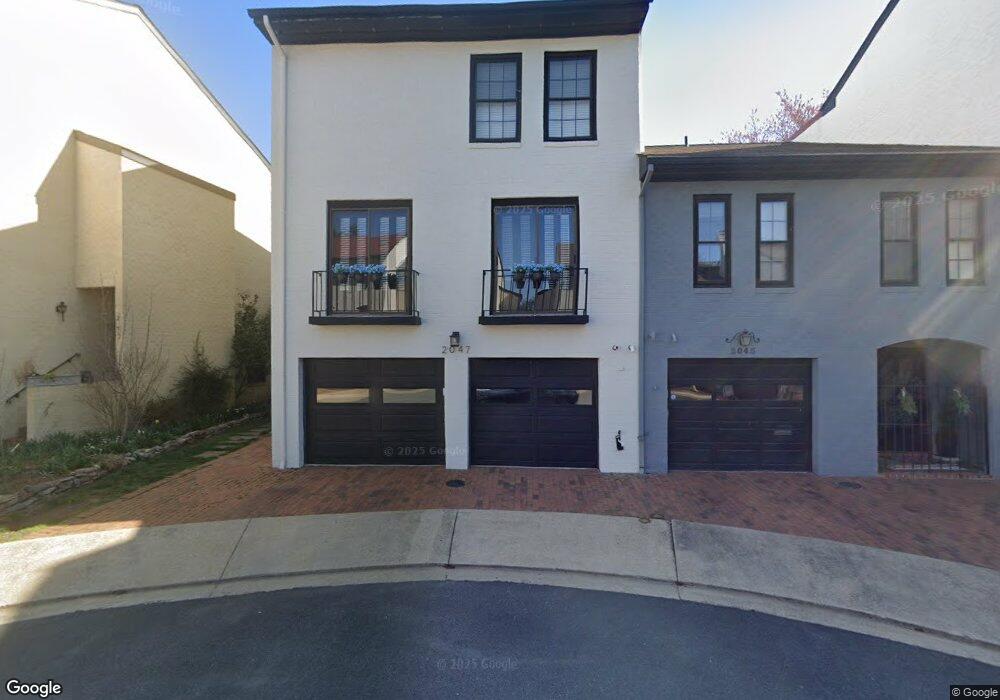
2047 N Abingdon St Arlington, VA 22207
Glebewood NeighborhoodEstimated Value: $932,000 - $1,060,000
3
Beds
4
Baths
2,999
Sq Ft
$336/Sq Ft
Est. Value
About This Home
This home is located at 2047 N Abingdon St, Arlington, VA 22207 and is currently estimated at $1,008,119, approximately $336 per square foot. 2047 N Abingdon St is a home located in Arlington County with nearby schools including Glebe Elementary School, Swanson Middle School, and Yorktown High School.
Ownership History
Date
Name
Owned For
Owner Type
Purchase Details
Closed on
Aug 30, 2021
Sold by
Pitchford John Michael and Pitchford Sue Anne
Bought by
Pitchford Brian Steven and Pitchford Andrea Lynne
Current Estimated Value
Purchase Details
Closed on
Aug 29, 2019
Sold by
Pitchford John Michael and Pitchford Sue Anne
Bought by
Pitchford John Michael and Pitchford Sue Anne
Home Financials for this Owner
Home Financials are based on the most recent Mortgage that was taken out on this home.
Original Mortgage
$620,000
Outstanding Balance
$544,181
Interest Rate
3.7%
Mortgage Type
Construction
Estimated Equity
$463,938
Purchase Details
Closed on
May 31, 2019
Sold by
Pitchford John Michael and Pitchford Sue Anne
Bought by
Pitchford John Michael and Pitchford Sue Anne
Purchase Details
Closed on
Sep 22, 2014
Sold by
Pitchford John Michael and Pitchford Sue Anne
Bought by
Pitchford John Michael and Pitchford Kevin
Purchase Details
Closed on
Jun 24, 2005
Sold by
Cole David
Bought by
Pitchford John
Home Financials for this Owner
Home Financials are based on the most recent Mortgage that was taken out on this home.
Original Mortgage
$544,000
Interest Rate
5.73%
Mortgage Type
New Conventional
Create a Home Valuation Report for This Property
The Home Valuation Report is an in-depth analysis detailing your home's value as well as a comparison with similar homes in the area
Home Values in the Area
Average Home Value in this Area
Purchase History
| Date | Buyer | Sale Price | Title Company |
|---|---|---|---|
| Pitchford Brian Steven | -- | Total Title | |
| Pitchford John Michael | -- | None Available | |
| Pitchford John Michael | -- | None Available | |
| Pitchford John Michael | -- | -- | |
| Pitchford John | $650,000 | -- |
Source: Public Records
Mortgage History
| Date | Status | Borrower | Loan Amount |
|---|---|---|---|
| Open | Pitchford John Michael | $620,000 | |
| Previous Owner | Pitchford John | $544,000 |
Source: Public Records
Tax History Compared to Growth
Tax History
| Year | Tax Paid | Tax Assessment Tax Assessment Total Assessment is a certain percentage of the fair market value that is determined by local assessors to be the total taxable value of land and additions on the property. | Land | Improvement |
|---|---|---|---|---|
| 2025 | $9,382 | $908,200 | $600,000 | $308,200 |
| 2024 | $9,382 | $908,200 | $600,000 | $308,200 |
| 2023 | $8,832 | $857,500 | $560,000 | $297,500 |
| 2022 | $8,584 | $833,400 | $525,000 | $308,400 |
| 2021 | $8,038 | $780,400 | $500,000 | $280,400 |
| 2020 | $7,826 | $762,800 | $475,000 | $287,800 |
| 2019 | $7,567 | $737,500 | $445,000 | $292,500 |
| 2018 | $7,417 | $737,300 | $445,000 | $292,300 |
| 2017 | $7,334 | $729,000 | $425,000 | $304,000 |
| 2016 | $6,995 | $705,900 | $425,000 | $280,900 |
| 2015 | $6,991 | $701,900 | $400,000 | $301,900 |
| 2014 | $6,604 | $663,100 | $390,000 | $273,100 |
Source: Public Records
Map
Nearby Homes
- 4741 20th St N
- 4730 19th St N
- 1713 N Cameron St
- 1712 N Culpeper St
- 2030 N Vermont St Unit 304
- 4401 Cherry Hill Rd Unit 67
- 2323 N Burlington St
- 2025 N Emerson St
- 5119 19th St N
- 5017 17th St N
- 4390 Lorcom Ln Unit 402
- 4343 Cherry Hill Rd Unit 605
- 5120 20th St N
- 2005 N Taylor St
- 1905 N Taylor St
- 4719 25th St N
- 0 N Emerson St
- 1801 N Taylor St
- 4201 Cherry Hill Rd Unit 504
- 2150 Patrick Henry Dr
- 2045 N Abingdon St
- 2051 N Abingdon St
- 2043 N Abingdon St
- 2053 N Abingdon St
- 2041 N Abingdon St
- 2055 N Abingdon St
- 2007 N Brandywine St
- 2050 N Abingdon St
- 2052 N Abingdon St
- 4684 20th Place N
- 4686 20th Place N
- 2048 N Abingdon St
- 2044 N Abingdon St
- 2005 N Brandywine St
- 2040 N Abingdon St
- 2054 N Abingdon St
- 4682 20th Place N
- 2003 N Brandywine St
- 2003 N Brandywine St
- 2003 N Brandywine St