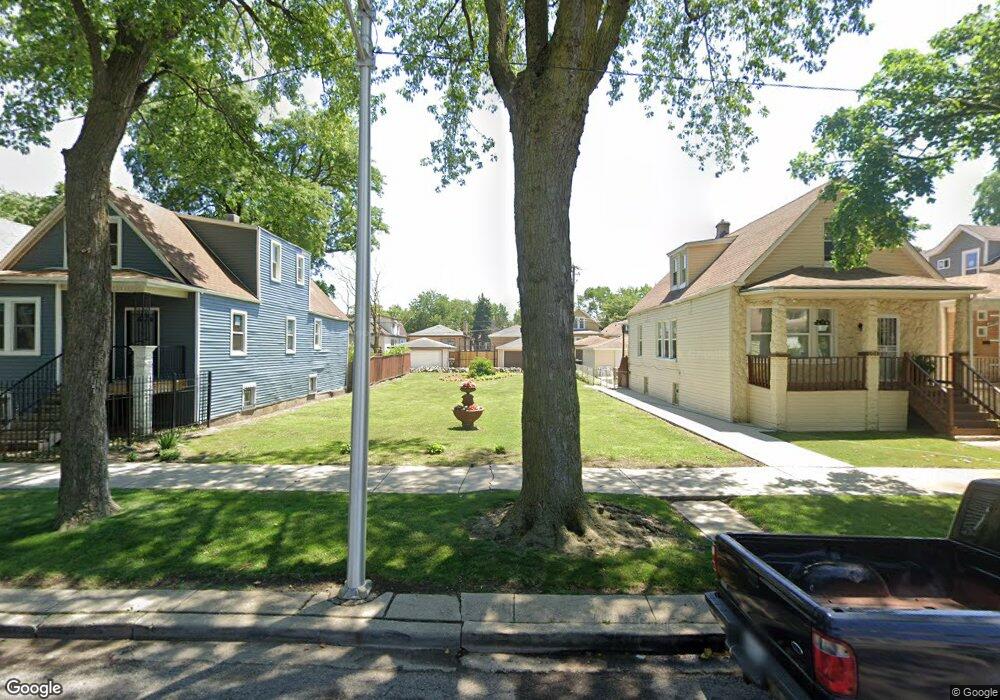
2047 W 70th Place Chicago, IL 60636
Englewood NeighborhoodEstimated Value: $152,000 - $238,390
--
Bed
2
Baths
1,634
Sq Ft
$119/Sq Ft
Est. Value
About This Home
This home is located at 2047 W 70th Place, Chicago, IL 60636 and is currently estimated at $195,195, approximately $119 per square foot. 2047 W 70th Place is a home located in Cook County with nearby schools including Randolph Elementary School and The Montessori School of Englewood Charter School.
Ownership History
Date
Name
Owned For
Owner Type
Purchase Details
Closed on
May 31, 2005
Sold by
Village Sites Inc
Bought by
Diaz Adolfo A
Current Estimated Value
Home Financials for this Owner
Home Financials are based on the most recent Mortgage that was taken out on this home.
Original Mortgage
$166,500
Outstanding Balance
$104,106
Interest Rate
9%
Mortgage Type
Unknown
Estimated Equity
$91,089
Purchase Details
Closed on
Feb 23, 2005
Sold by
Lewis
Bought by
Village Sites Inc
Purchase Details
Closed on
Apr 30, 1996
Sold by
Kirkland Curtis
Bought by
Lewis Jessie
Home Financials for this Owner
Home Financials are based on the most recent Mortgage that was taken out on this home.
Original Mortgage
$59,969
Interest Rate
7.86%
Mortgage Type
FHA
Purchase Details
Closed on
May 8, 1995
Sold by
Equicredit Corp Of Illinois
Bought by
Kirkland Curtis
Purchase Details
Closed on
Jan 2, 1995
Sold by
Carter Ruth
Bought by
Equicredit Corp Of Illinois
Create a Home Valuation Report for This Property
The Home Valuation Report is an in-depth analysis detailing your home's value as well as a comparison with similar homes in the area
Home Values in the Area
Average Home Value in this Area
Purchase History
| Date | Buyer | Sale Price | Title Company |
|---|---|---|---|
| Diaz Adolfo A | $185,000 | Tristar Title Llc | |
| Village Sites Inc | $65,000 | -- | |
| Lewis Jessie | $60,000 | Ati Title Company | |
| Kirkland Curtis | $46,500 | 1St American Title | |
| Equicredit Corp Of Illinois | -- | -- |
Source: Public Records
Mortgage History
| Date | Status | Borrower | Loan Amount |
|---|---|---|---|
| Open | Diaz Adolfo A | $166,500 | |
| Previous Owner | Lewis Jessie | $59,969 |
Source: Public Records
Tax History Compared to Growth
Tax History
| Year | Tax Paid | Tax Assessment Tax Assessment Total Assessment is a certain percentage of the fair market value that is determined by local assessors to be the total taxable value of land and additions on the property. | Land | Improvement |
|---|---|---|---|---|
| 2024 | $850 | $1,860 | $1,860 | -- |
| 2023 | $829 | $4,030 | $4,030 | -- |
| 2022 | $829 | $4,030 | $4,030 | $0 |
| 2021 | $810 | $4,030 | $4,030 | $0 |
| 2020 | $898 | $4,030 | $4,030 | $0 |
| 2019 | $810 | $4,030 | $4,030 | $0 |
| 2018 | $796 | $4,030 | $4,030 | $0 |
| 2017 | $801 | $3,720 | $3,720 | $0 |
| 2016 | $745 | $3,720 | $3,720 | $0 |
| 2015 | $682 | $3,720 | $3,720 | $0 |
| 2014 | $633 | $3,410 | $3,410 | $0 |
| 2013 | $620 | $3,410 | $3,410 | $0 |
Source: Public Records
Map
Nearby Homes
- 7031 S Damen Ave
- 7130 S Seeley Ave
- 2118 W 70th Place
- 2101 W 69th St
- 7159 S Winchester Ave
- 7056 S Honore St
- 1851 W 71st St
- 7120 S Honore St
- 7133 S Honore St
- 1809 W 71st St
- 6942 S Bell Ave
- 7019 S Oakley Ave
- 6825 S Winchester Ave
- 7015 S Wood St
- 6943 S Bell Ave
- 2315 W 71st St
- 2310 W 72nd St
- 2047 W 67th Place
- 2309 W 72nd St
- 7252 S Wood St
- 2049 W 70th Place
- 2051 W 70th Place
- 2041 W 70th Place
- 2053 W 70th Place
- 2039 W 70th Place
- 2057 W 70th Place
- 2037 W 70th Place
- 2059 W 70th Place
- 2035 W 70th Place
- 2031 W 70th Place
- 2044 W 71st St
- 2048 W 71st St
- 2052 W 70th Place
- 2040 W 71st St
- 2050 W 71st St
- 2046 W 70th Place
- 2048 W 70th Place
- 2042 W 70th Place
- 2040 W 70th Place
- 2052 W 71st St