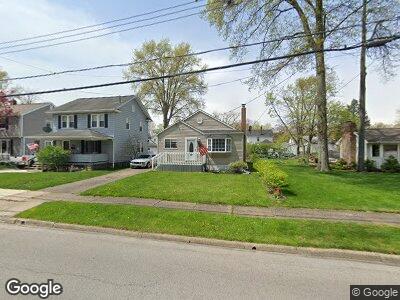
2048 15th St Cuyahoga Falls, OH 44223
Broad Boulevard NeighborhoodEstimated Value: $150,000 - $194,000
3
Beds
1
Bath
884
Sq Ft
$195/Sq Ft
Est. Value
About This Home
This home is located at 2048 15th St, Cuyahoga Falls, OH 44223 and is currently estimated at $172,293, approximately $194 per square foot. 2048 15th St is a home located in Summit County with nearby schools including Richardson Elementary School, Bolich Middle School, and Cuyahoga Falls High School.
Ownership History
Date
Name
Owned For
Owner Type
Purchase Details
Closed on
May 22, 2015
Sold by
Shook Allan J and Shook Tracy L
Bought by
Adkins James D
Current Estimated Value
Purchase Details
Closed on
Oct 3, 2002
Sold by
Freeman Daniel P and Freeman Amy M
Bought by
Shook Allan J and Shook Tracy L
Home Financials for this Owner
Home Financials are based on the most recent Mortgage that was taken out on this home.
Original Mortgage
$118,552
Interest Rate
6.34%
Mortgage Type
FHA
Purchase Details
Closed on
Jul 24, 1996
Sold by
Dolan Mark A
Bought by
Freeman Daniel P and Freeman Amy M
Home Financials for this Owner
Home Financials are based on the most recent Mortgage that was taken out on this home.
Original Mortgage
$99,000
Interest Rate
8.43%
Mortgage Type
New Conventional
Create a Home Valuation Report for This Property
The Home Valuation Report is an in-depth analysis detailing your home's value as well as a comparison with similar homes in the area
Home Values in the Area
Average Home Value in this Area
Purchase History
| Date | Buyer | Sale Price | Title Company |
|---|---|---|---|
| Adkins James D | $97,000 | Quest Title Agency | |
| Shook Allan J | $119,500 | Endress/Lawyers Title | |
| Freeman Daniel P | $116,500 | -- |
Source: Public Records
Mortgage History
| Date | Status | Borrower | Loan Amount |
|---|---|---|---|
| Previous Owner | Shook Allan J | $122,510 | |
| Previous Owner | Shook Allan J | $7,000 | |
| Previous Owner | Shook Allan J | $118,552 | |
| Previous Owner | Freeman Daniel P | $99,000 |
Source: Public Records
Tax History Compared to Growth
Tax History
| Year | Tax Paid | Tax Assessment Tax Assessment Total Assessment is a certain percentage of the fair market value that is determined by local assessors to be the total taxable value of land and additions on the property. | Land | Improvement |
|---|---|---|---|---|
| 2025 | $2,434 | $45,088 | $9,797 | $35,291 |
| 2024 | $2,434 | $45,088 | $9,797 | $35,291 |
| 2023 | $2,434 | $45,088 | $9,797 | $35,291 |
| 2022 | $2,271 | $34,164 | $7,368 | $26,796 |
| 2021 | $2,271 | $34,164 | $7,368 | $26,796 |
| 2020 | $2,234 | $34,170 | $7,370 | $26,800 |
| 2019 | $2,450 | $34,140 | $7,290 | $26,850 |
| 2018 | $2,081 | $34,140 | $7,290 | $26,850 |
| 2017 | $1,920 | $34,140 | $7,290 | $26,850 |
| 2016 | $1,922 | $31,930 | $7,290 | $24,640 |
| 2015 | $1,920 | $31,930 | $7,290 | $24,640 |
| 2014 | $1,921 | $31,930 | $7,290 | $24,640 |
| 2013 | $1,905 | $31,930 | $7,290 | $24,640 |
Source: Public Records
Map
Nearby Homes