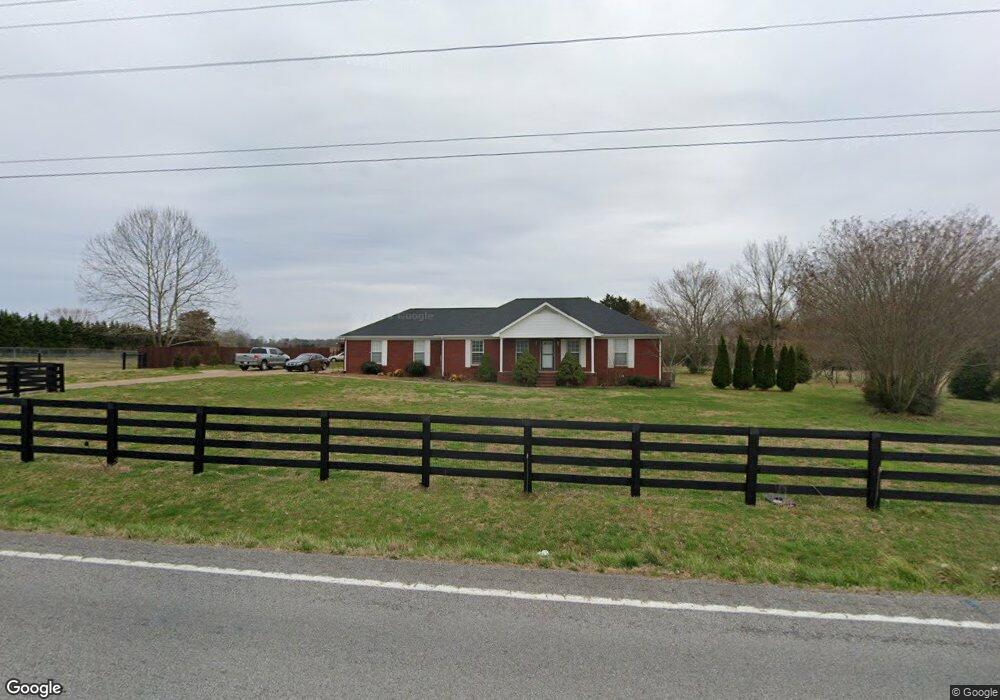
2048 Ardmore Hwy Ardmore, TN 38449
Estimated Value: $363,000 - $399,000
3
Beds
2
Baths
1,611
Sq Ft
$237/Sq Ft
Est. Value
About This Home
This home is located at 2048 Ardmore Hwy, Ardmore, TN 38449 and is currently estimated at $381,441, approximately $236 per square foot. 2048 Ardmore Hwy is a home located in Lincoln County with nearby schools including Blanche School, Lincoln Central Academy, and Lincoln County High School.
Ownership History
Date
Name
Owned For
Owner Type
Purchase Details
Closed on
May 26, 2011
Sold by
Ervin Sam J
Bought by
Lowery Perry and Lowery Deborah E
Current Estimated Value
Home Financials for this Owner
Home Financials are based on the most recent Mortgage that was taken out on this home.
Original Mortgage
$134,320
Outstanding Balance
$92,291
Interest Rate
4.79%
Mortgage Type
Commercial
Estimated Equity
$289,150
Purchase Details
Closed on
Feb 5, 2007
Sold by
Pollock Philip E
Bought by
Sam Ervin
Purchase Details
Closed on
Feb 18, 1998
Sold by
Smith Billy C
Bought by
Pollock Philip E and Pollock Dana L
Purchase Details
Closed on
Aug 18, 1997
Sold by
Storey George D
Bought by
Smith Billy C
Purchase Details
Closed on
Apr 11, 1997
Bought by
Smith Billy C
Purchase Details
Closed on
Sep 17, 1996
Sold by
Ben Whitt
Bought by
Storey George D and Storey Annie
Purchase Details
Closed on
May 24, 1973
Bought by
Whitt Ben
Create a Home Valuation Report for This Property
The Home Valuation Report is an in-depth analysis detailing your home's value as well as a comparison with similar homes in the area
Home Values in the Area
Average Home Value in this Area
Purchase History
| Date | Buyer | Sale Price | Title Company |
|---|---|---|---|
| Lowery Perry | $167,900 | -- | |
| Lowery Perry | $167,900 | -- | |
| Sam Ervin | $196,500 | -- | |
| Pollock Philip E | $98,000 | -- | |
| Pollock Philip E | $98,000 | -- | |
| Smith Billy C | $15,000 | -- | |
| Smith Billy C | $15,000 | -- | |
| Smith Billy C | $15,000 | -- | |
| Smith Billy C | $15,000 | -- | |
| Storey George D | $14,000 | -- | |
| Storey George D | $14,000 | -- | |
| Whitt Ben | -- | -- | |
| Whitt Ben | -- | -- |
Source: Public Records
Mortgage History
| Date | Status | Borrower | Loan Amount |
|---|---|---|---|
| Open | Lowery Perry | $134,320 | |
| Closed | Lowery Perry | $134,320 |
Source: Public Records
Tax History Compared to Growth
Tax History
| Year | Tax Paid | Tax Assessment Tax Assessment Total Assessment is a certain percentage of the fair market value that is determined by local assessors to be the total taxable value of land and additions on the property. | Land | Improvement |
|---|---|---|---|---|
| 2025 | $1,513 | $79,625 | $0 | $0 |
| 2024 | $1,513 | $79,625 | $25,750 | $53,875 |
| 2023 | $1,326 | $46,025 | $12,100 | $33,925 |
| 2022 | $967 | $46,025 | $12,100 | $33,925 |
| 2021 | $967 | $46,025 | $12,100 | $33,925 |
| 2020 | $967 | $46,025 | $12,100 | $33,925 |
| 2019 | $967 | $46,025 | $12,100 | $33,925 |
| 2018 | $1,060 | $42,725 | $10,700 | $32,025 |
| 2017 | $1,000 | $42,725 | $10,700 | $32,025 |
| 2016 | $1,000 | $42,725 | $10,700 | $32,025 |
| 2015 | -- | $42,725 | $10,700 | $32,025 |
| 2014 | $837 | $42,725 | $10,700 | $32,025 |
Source: Public Records
Map
Nearby Homes
- 1999 Ardmore Hwy
- 1997 Ardmore Hwy
- 2126 Ardmore Hwy
- 93 Merrill Rd
- 61 Minnie Brown Rd
- 113 Elliot Rd
- 167 Henry Bayless Rd
- 30619 Highway 110
- 29771 Little Creek Rd
- 29795 Gatlin Rd
- 30A Stevenson Rd
- 30acres Stevenson Rd
- 30518 Fort Hampton St
- 239 Henry Bayless Rd
- 30176 Highway 110
- 27615 Shannon Rd
- 29419 Old School House Rd
- 30679 Ardmore Ridge Rd
- 26651 1st St
- 26081 Pheasant Run
- 2044 Ardmore Hwy
- 2042 Ardmore Hwy
- 2070 Ardmore Hwy
- 2024 Ardmore Hwy
- 2019 Ardmore Hwy
- 2076 Ardmore Hwy
- 2084 Ardmore Hwy
- 3 Gatlin Rd
- 30 Asa Smith Rd
- 30 Asa Smith Rd
- 53 Asa Smith Rd
- 9 Gatlin Rd
- 9 Gatlin Rd
- 13 Gatlin Rd
- 2007 Ardmore Hwy
- 2005 Ardmore Hwy
- 10 Asa Smith Rd
- 2091 Ardmore Hwy
- 2003 Ardmore Hwy
- 3 Asa Smith Rd