20486 Temelec Way Reno, NV 89521
Pleasant Valley NeighborhoodEstimated Value: $824,401 - $933,000
4
Beds
3
Baths
2,951
Sq Ft
$295/Sq Ft
Est. Value
About This Home
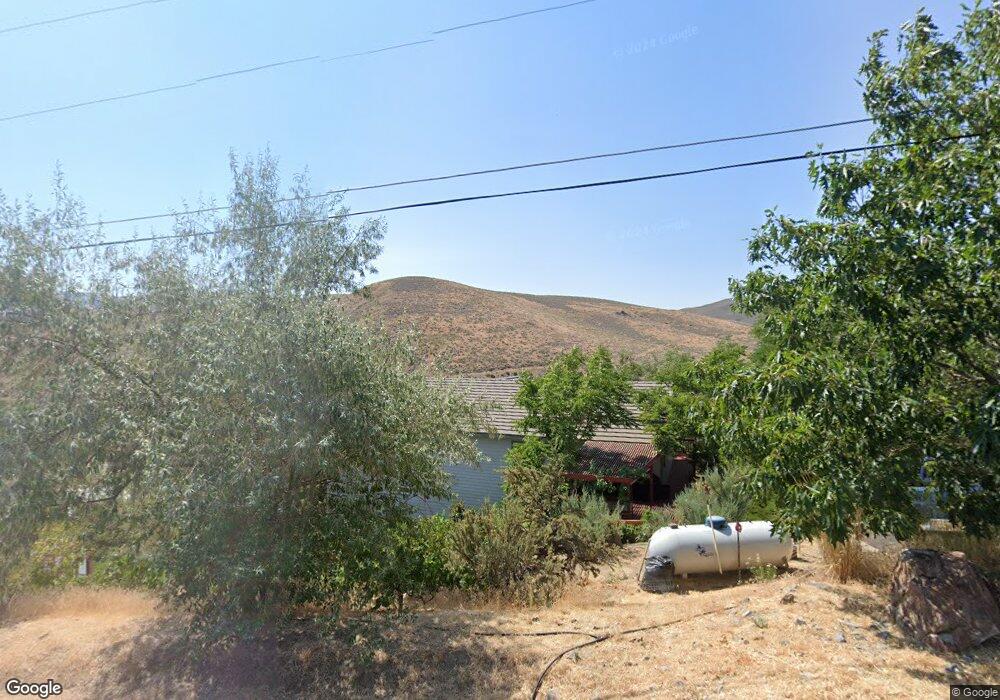
This home is located at 20486 Temelec Way, Reno, NV 89521 and is currently estimated at $870,850, approximately $295 per square foot. 20486 Temelec Way is a home located in Washoe County with nearby schools including Pleasant Valley Elementary School, Marce Herz Middle School, and Galena High School.
Ownership History
Date
Name
Owned For
Owner Type
Purchase Details
Closed on
Jan 25, 2020
Sold by
Benoit Steven M and Benoit Helen E
Bought by
Benoit Steven M and Benoit Helen E
Current Estimated Value
Home Financials for this Owner
Home Financials are based on the most recent Mortgage that was taken out on this home.
Original Mortgage
$194,350
Outstanding Balance
$171,452
Interest Rate
3.74%
Mortgage Type
New Conventional
Estimated Equity
$699,398
Purchase Details
Closed on
Feb 15, 2019
Sold by
Benoit Steven M and Benoit Helen E
Bought by
Benoit Steven M and Benoit Helen E
Purchase Details
Closed on
Jan 19, 1994
Sold by
Bonfield Gaylord E
Bought by
Benoit Steven M and Benoit Helen E
Home Financials for this Owner
Home Financials are based on the most recent Mortgage that was taken out on this home.
Original Mortgage
$160,000
Interest Rate
7.09%
Create a Home Valuation Report for This Property
The Home Valuation Report is an in-depth analysis detailing your home's value as well as a comparison with similar homes in the area
Home Values in the Area
Average Home Value in this Area
Purchase History
| Date | Buyer | Sale Price | Title Company |
|---|---|---|---|
| Benoit Steven M | -- | Amrock Inc | |
| Benoit Steven M | -- | Amrock Inc | |
| Benoit Steven M | -- | None Available | |
| Benoit Steven M | -- | First Centennial Title Co |
Source: Public Records
Mortgage History
| Date | Status | Borrower | Loan Amount |
|---|---|---|---|
| Open | Benoit Steven M | $194,350 | |
| Previous Owner | Benoit Steven M | $160,000 |
Source: Public Records
Tax History Compared to Growth
Tax History
| Year | Tax Paid | Tax Assessment Tax Assessment Total Assessment is a certain percentage of the fair market value that is determined by local assessors to be the total taxable value of land and additions on the property. | Land | Improvement |
|---|---|---|---|---|
| 2026 | $3,377 | $163,698 | $52,500 | $111,199 |
| 2025 | $4,373 | $162,692 | $49,000 | $113,692 |
| 2024 | $4,246 | $160,805 | $45,500 | $115,305 |
| 2023 | $3,090 | $151,748 | $42,000 | $109,748 |
| 2022 | $4,122 | $130,041 | $38,500 | $91,541 |
| 2021 | $4,002 | $125,837 | $34,650 | $91,187 |
| 2020 | $3,885 | $123,974 | $31,850 | $92,124 |
| 2019 | $3,772 | $121,332 | $31,500 | $89,832 |
| 2018 | $3,662 | $114,418 | $26,250 | $88,168 |
| 2017 | $3,497 | $111,572 | $28,000 | $83,572 |
| 2016 | $3,410 | $114,377 | $28,000 | $86,377 |
| 2015 | $3,401 | $108,389 | $21,000 | $87,389 |
| 2014 | $3,302 | $101,911 | $17,500 | $84,411 |
| 2013 | -- | $100,336 | $17,500 | $82,836 |
Source: Public Records
Map
Nearby Homes
- 20475 Temelec Way
- 20217 S Virginia St
- 20855 Ames Ln
- 20890 Eaton Rd
- 000 No Street Name
- 315 Neilson Rd
- 330 Neilson Rd
- 307 Neilson Rd
- 251 Theobald Ln
- 55 Hidden Lake Dr
- 22860 Carriage Dr
- 22855 Carriage Dr
- 95 Hidden Lake Dr
- 5 Connie Way
- 95 Ox-Yoke Ln
- 1020 N Cantlon Ln
- 4080 Twin Falls Dr
- 3796 Bellingham Dr
- 40 Zircon Dr Unit 22
- 0 Chance Ln
- 20490 Temelec Way
- 20490 Cooke Dr
- 20485 Cooke Dr
- 20495 Temelec Way
- 20485 Temelec Way
- 20515 Cooke Dr
- 20500 Cooke Dr
- 20470 Cooke Dr
- 20464 Temelec Way Unit 2
- 20545 Cooke Dr
- 20505 S Virginia St
- 20505 Us Highway 395 S
- 20460 Cooke Dr
- 20485 S Virginia St
- 20540 Eaton Rd
- 20505 Temelec Way
- 20515 Us Highway 395 S
- 20465 Temelec Way
- 20515 S Virginia St
- 20213 S Virginia St