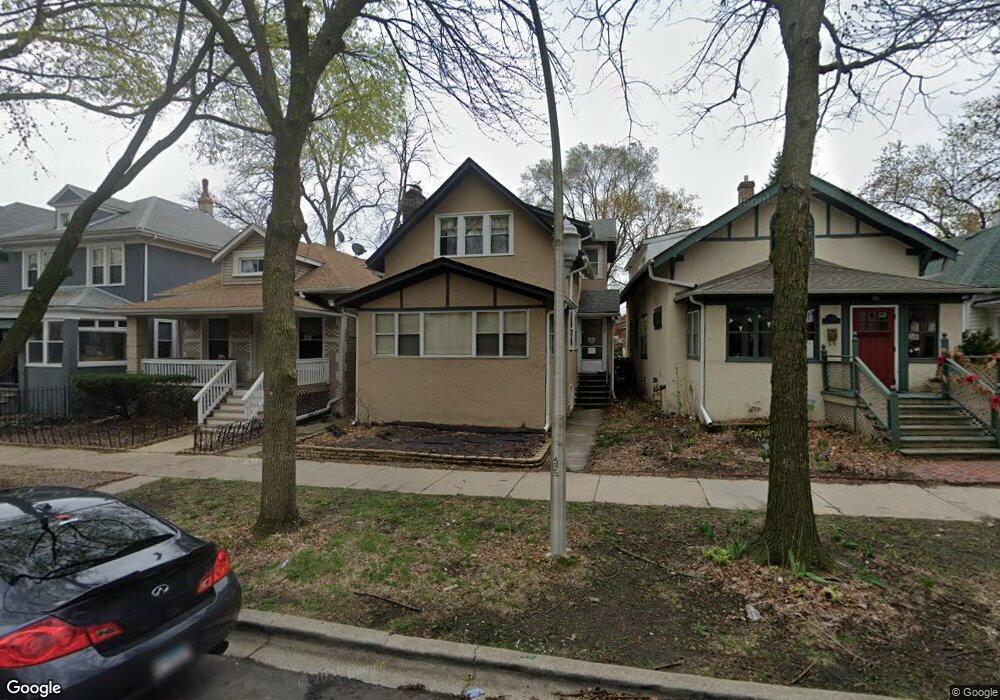
2049 W Chase Ave Chicago, IL 60645
Rogers Park NeighborhoodEstimated Value: $447,000 - $560,993
4
Beds
2
Baths
1,992
Sq Ft
$254/Sq Ft
Est. Value
About This Home
This home is located at 2049 W Chase Ave, Chicago, IL 60645 and is currently estimated at $505,998, approximately $254 per square foot. 2049 W Chase Ave is a home located in Cook County with nearby schools including George Armstrong Elementary School, Sullivan High School, and Acero - Sor Juana Ines de la Cruz School.
Ownership History
Date
Name
Owned For
Owner Type
Purchase Details
Closed on
Aug 9, 2005
Sold by
Stahi Leslie J
Bought by
Suarez David C and Rivera Michele
Current Estimated Value
Home Financials for this Owner
Home Financials are based on the most recent Mortgage that was taken out on this home.
Original Mortgage
$232,000
Outstanding Balance
$123,669
Interest Rate
5.89%
Mortgage Type
Fannie Mae Freddie Mac
Estimated Equity
$382,329
Purchase Details
Closed on
Jun 3, 2005
Sold by
Huey Daniel J
Bought by
Stahl Leslie J
Home Financials for this Owner
Home Financials are based on the most recent Mortgage that was taken out on this home.
Original Mortgage
$160,000
Interest Rate
10%
Mortgage Type
Unknown
Purchase Details
Closed on
Aug 14, 1996
Sold by
Lyon Robert and Thrasher Penelope
Bought by
Stahl Leslie J and Huey Daniel J
Home Financials for this Owner
Home Financials are based on the most recent Mortgage that was taken out on this home.
Original Mortgage
$126,400
Interest Rate
7.91%
Create a Home Valuation Report for This Property
The Home Valuation Report is an in-depth analysis detailing your home's value as well as a comparison with similar homes in the area
Home Values in the Area
Average Home Value in this Area
Purchase History
| Date | Buyer | Sale Price | Title Company |
|---|---|---|---|
| Suarez David C | $290,000 | Pntn | |
| Stahl Leslie J | -- | National Title Center Inc | |
| Stahl Leslie J | $140,500 | Attorneys Natl Title Network |
Source: Public Records
Mortgage History
| Date | Status | Borrower | Loan Amount |
|---|---|---|---|
| Open | Suarez David C | $232,000 | |
| Previous Owner | Stahl Leslie J | $160,000 | |
| Previous Owner | Stahl Leslie J | $126,400 |
Source: Public Records
Tax History Compared to Growth
Tax History
| Year | Tax Paid | Tax Assessment Tax Assessment Total Assessment is a certain percentage of the fair market value that is determined by local assessors to be the total taxable value of land and additions on the property. | Land | Improvement |
|---|---|---|---|---|
| 2024 | $6,525 | $48,000 | $10,332 | $37,668 |
| 2023 | $6,843 | $34,242 | $8,266 | $25,976 |
| 2022 | $6,843 | $36,692 | $8,266 | $28,426 |
| 2021 | $7,374 | $39,999 | $8,265 | $31,734 |
| 2020 | $7,145 | $35,177 | $6,658 | $28,519 |
| 2019 | $7,190 | $39,216 | $6,658 | $32,558 |
| 2018 | $7,068 | $39,216 | $6,658 | $32,558 |
| 2017 | $7,162 | $36,645 | $5,969 | $30,676 |
| 2016 | $6,839 | $36,645 | $5,969 | $30,676 |
| 2015 | $6,545 | $38,339 | $5,969 | $32,370 |
| 2014 | $5,720 | $33,398 | $5,510 | $27,888 |
| 2013 | $5,596 | $33,398 | $5,510 | $27,888 |
Source: Public Records
Map
Nearby Homes
- 7228 N Rogers Ave
- 2109 W Jarvis Ave Unit 1
- 2044 W Jarvis Ave Unit 3G
- 7227 N Damen Ave
- 7223 N Damen Ave
- 2038 W Jarvis Ave Unit 20382D
- 2038 W Jarvis Ave Unit 2F
- 7207 N Damen Ave Unit 2
- 7320 N Rogers Ave Unit 514
- 7102 N Damen Ave Unit 3
- 7234 N Hamilton Ave
- 7344 N Ridge Blvd Unit 5C
- 7074 N Ridge Blvd Unit 1E
- 7348 N Ridge Blvd Unit 16B
- 7070 N Ridge Blvd Unit 1A
- 7252 N Bell Ave
- 2175 W Touhy Ave
- 7315 N Oakley Ave Unit 1A
- 7223 N Oakley Ave Unit 1E
- 2224 W Touhy Ave Unit 3N
- 2053 W Chase Ave
- 2047 W Chase Ave
- 2055 W Chase Ave
- 2043 W Chase Ave
- 2041 W Chase Ave
- 2057 W Chase Ave
- 2057 W Chase Ave
- 2037 W Chase Ave Unit 1
- 2037 W Chase Ave Unit 2
- 2037 W Chase Ave
- 2035 W Chase Ave
- 7214 N Rogers Ave
- 7214 N Rogers Ave
- 7220 N Rogers Ave Unit B
- 7220 N Rogers Ave
- 7220 N Rogers Ave
- 7220 N Rogers Ave
- 2031 W Chase Ave
- 7245 N Ridge Blvd
- 7238 N Rogers Ave N