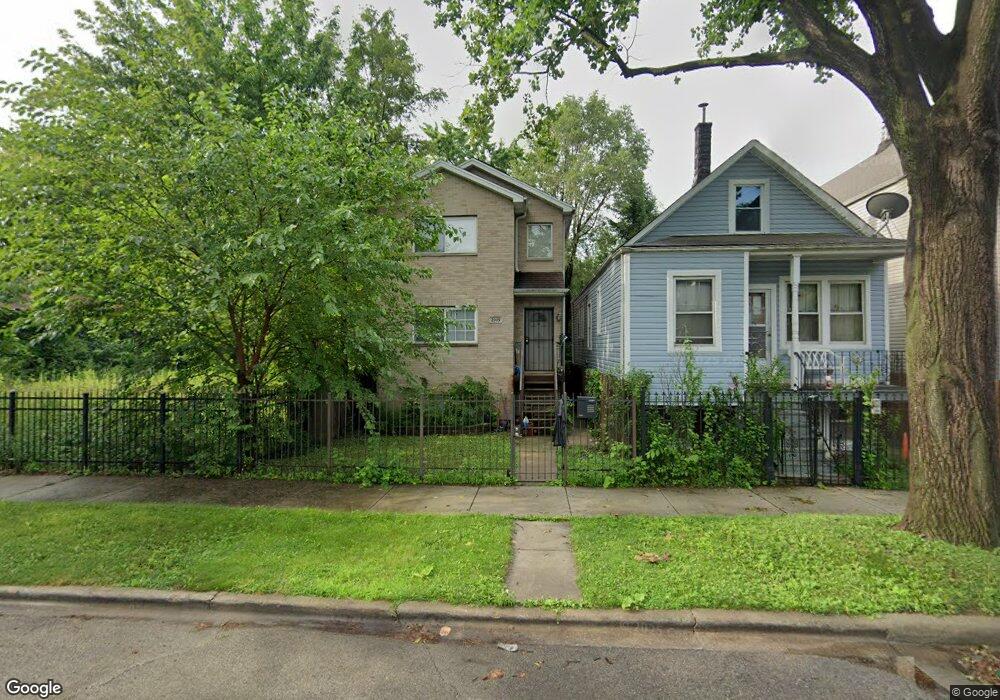
2049 W James St Chicago, IL 60609
Back of the Yards NeighborhoodEstimated Value: $233,000 - $283,000
3
Beds
2
Baths
1,484
Sq Ft
$171/Sq Ft
Est. Value
About This Home
This home is located at 2049 W James St, Chicago, IL 60609 and is currently estimated at $253,271, approximately $170 per square foot. 2049 W James St is a home located in Cook County with nearby schools including Fulton Elementary School and CICS Basil.
Ownership History
Date
Name
Owned For
Owner Type
Purchase Details
Closed on
Aug 16, 2010
Sold by
Mb 812 Llc
Bought by
Lee Erika M
Current Estimated Value
Home Financials for this Owner
Home Financials are based on the most recent Mortgage that was taken out on this home.
Original Mortgage
$65,123
Interest Rate
4.16%
Mortgage Type
FHA
Purchase Details
Closed on
May 26, 2010
Sold by
Mt Power Corp
Bought by
Mb 812 Llc
Purchase Details
Closed on
Nov 16, 2006
Sold by
First National Acquisitions Llc
Bought by
Mt Power Corp
Purchase Details
Closed on
Aug 18, 2005
Sold by
Orr David D
Bought by
First National Acquisitions Llc
Purchase Details
Closed on
May 4, 1998
Sold by
Vascas Inc
Bought by
Will Feed Community Organization Inc
Home Financials for this Owner
Home Financials are based on the most recent Mortgage that was taken out on this home.
Original Mortgage
$325,000
Interest Rate
7%
Purchase Details
Closed on
Nov 21, 1997
Sold by
Will Feed Community Organization
Bought by
Vascas Inc
Purchase Details
Closed on
Oct 20, 1997
Sold by
Hud
Bought by
Will Feed Community Organization Inc
Create a Home Valuation Report for This Property
The Home Valuation Report is an in-depth analysis detailing your home's value as well as a comparison with similar homes in the area
Home Values in the Area
Average Home Value in this Area
Purchase History
| Date | Buyer | Sale Price | Title Company |
|---|---|---|---|
| Lee Erika M | $66,000 | First American | |
| Mb 812 Llc | -- | None Available | |
| Mt Power Corp | $31,500 | Lasalle Title | |
| First National Acquisitions Llc | -- | -- | |
| Will Feed Community Organization Inc | $38,000 | Intercounty Title | |
| Vascas Inc | -- | -- | |
| Will Feed Community Organization Inc | -- | -- |
Source: Public Records
Mortgage History
| Date | Status | Borrower | Loan Amount |
|---|---|---|---|
| Previous Owner | Lee Erika M | $65,123 | |
| Previous Owner | Will Feed Community Organization Inc | $325,000 |
Source: Public Records
Tax History
| Year | Tax Paid | Tax Assessment Tax Assessment Total Assessment is a certain percentage of the fair market value that is determined by local assessors to be the total taxable value of land and additions on the property. | Land | Improvement |
|---|---|---|---|---|
| 2025 | $2,479 | $21,000 | $1,065 | $19,935 |
| 2024 | $2,479 | $21,000 | $1,065 | $19,935 |
| 2023 | $2,395 | $15,001 | $2,308 | $12,693 |
| 2022 | $2,395 | $15,001 | $2,308 | $12,693 |
| 2021 | $2,346 | $14,999 | $2,307 | $12,692 |
| 2020 | $1,971 | $11,894 | $2,307 | $9,587 |
| 2019 | $2,702 | $13,364 | $2,307 | $11,057 |
| 2018 | $2,657 | $13,364 | $2,307 | $11,057 |
| 2017 | $2,332 | $10,761 | $2,130 | $8,631 |
| 2016 | $2,169 | $10,761 | $2,130 | $8,631 |
| 2015 | $1,986 | $10,761 | $2,130 | $8,631 |
| 2014 | $2,113 | $11,301 | $1,952 | $9,349 |
| 2013 | $2,072 | $11,301 | $1,952 | $9,349 |
Source: Public Records
Map
Nearby Homes
- 2050 W 52nd St
- 2103 W 52nd St
- 5045 S Hoyne Ave
- 5317 S Hamilton Ave
- 2139 W 50th Place
- 5244 S Honore St
- 5350 S Winchester Ave
- 2223 W 50th Place
- 5217 S Wood St
- 5350 S Honore St
- 5225 S Wood St
- 1843 W 54th St
- 5338 S Wood St
- 2309 W 50th Place
- 5427 S Wolcott Ave
- 2208 W 54th Place
- 1900 W Garfield Blvd
- 2009 W Garfield Blvd
- 4822 S Seeley Ave
- 5519 S Seeley Ave
- 2053 W James St
- 2045 W James St
- 2055 W James St
- 2055 W James St
- 2041 W James St
- 2057 W James St
- 2039 W James St
- 2037 W James St
- 2048 W 52nd St
- 2048 W 52nd St
- 2035 W James St
- 2060 W 52nd St
- 2046 W 52nd St
- 2054 W 52nd St
- 2054 W James St
- 2054 W James St
- 2054 W James St Unit 1
- 2054 W James St
- 2050 W James St
- 2050 W James St
Your Personal Tour Guide
Ask me questions while you tour the home.