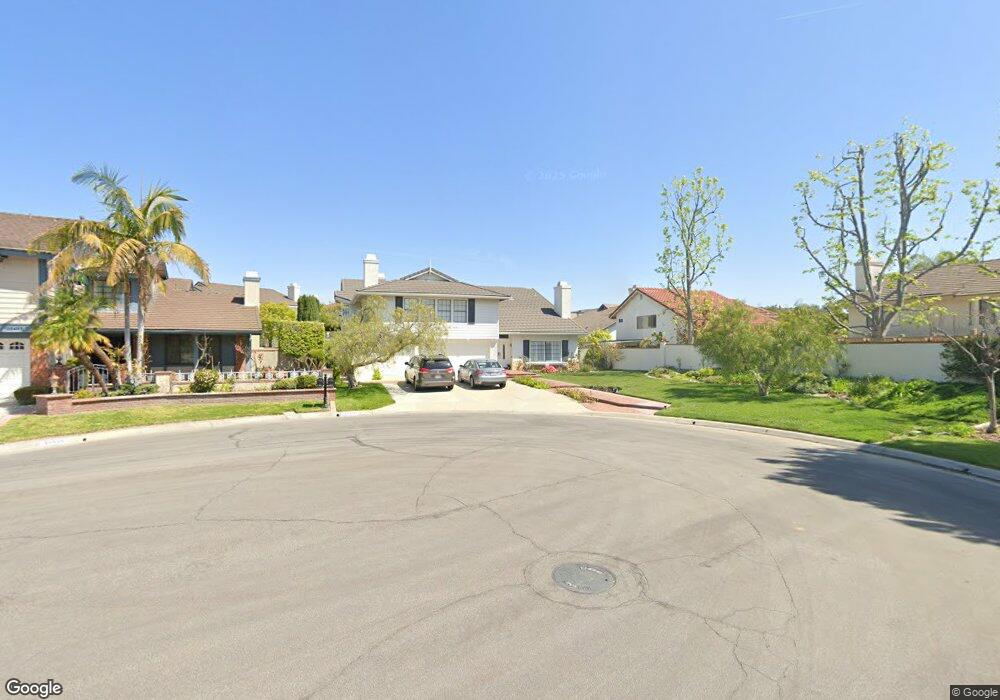
20495 Via Calderon Yorba Linda, CA 92886
Estimated Value: $1,693,000 - $2,017,000
4
Beds
3
Baths
3,813
Sq Ft
$494/Sq Ft
Est. Value
About This Home
This home is located at 20495 Via Calderon, Yorba Linda, CA 92886 and is currently estimated at $1,885,382, approximately $494 per square foot. 20495 Via Calderon is a home located in Orange County with nearby schools including Fairmont Elementary, Bernardo Yorba Middle School, and Ivycrest Montessori Private School - Yorba Linda.
Ownership History
Date
Name
Owned For
Owner Type
Purchase Details
Closed on
Feb 22, 2007
Sold by
Feary Mark W and Feary Carol Sharon
Bought by
Feary Mark W and Feary Carol Sharon
Current Estimated Value
Home Financials for this Owner
Home Financials are based on the most recent Mortgage that was taken out on this home.
Original Mortgage
$695,000
Interest Rate
6.21%
Mortgage Type
New Conventional
Purchase Details
Closed on
Jul 28, 2005
Sold by
Feary Living Trust
Bought by
Feary Mark W and Feary Carol Sharon
Home Financials for this Owner
Home Financials are based on the most recent Mortgage that was taken out on this home.
Original Mortgage
$650,000
Interest Rate
5.46%
Mortgage Type
New Conventional
Purchase Details
Closed on
Jan 2, 1996
Sold by
Feary Mark W and Feary Carol Sharon
Bought by
Feary Living Trust
Create a Home Valuation Report for This Property
The Home Valuation Report is an in-depth analysis detailing your home's value as well as a comparison with similar homes in the area
Home Values in the Area
Average Home Value in this Area
Purchase History
| Date | Buyer | Sale Price | Title Company |
|---|---|---|---|
| Feary Mark W | -- | First American Title Co | |
| Feary Mark W | -- | Fidelity National Title Co | |
| Feary Living Trust | -- | -- |
Source: Public Records
Mortgage History
| Date | Status | Borrower | Loan Amount |
|---|---|---|---|
| Closed | Feary Mark W | $695,000 | |
| Closed | Feary Mark W | $650,000 |
Source: Public Records
Tax History Compared to Growth
Tax History
| Year | Tax Paid | Tax Assessment Tax Assessment Total Assessment is a certain percentage of the fair market value that is determined by local assessors to be the total taxable value of land and additions on the property. | Land | Improvement |
|---|---|---|---|---|
| 2025 | $8,730 | $743,369 | $315,908 | $427,461 |
| 2024 | $8,730 | $728,794 | $309,714 | $419,080 |
| 2023 | $8,567 | $714,504 | $303,641 | $410,863 |
| 2022 | $8,459 | $700,495 | $297,688 | $402,807 |
| 2021 | $8,300 | $686,760 | $291,851 | $394,909 |
| 2020 | $8,198 | $679,719 | $288,859 | $390,860 |
| 2019 | $7,878 | $666,392 | $283,195 | $383,197 |
| 2018 | $7,802 | $653,326 | $277,642 | $375,684 |
| 2017 | $7,671 | $640,516 | $272,198 | $368,318 |
| 2016 | $7,516 | $627,957 | $266,860 | $361,097 |
| 2015 | $7,419 | $618,525 | $262,852 | $355,673 |
| 2014 | $7,204 | $606,409 | $257,703 | $348,706 |
Source: Public Records
Map
Nearby Homes
- 20455 Via Cadiz
- 5505 Calle Vista Linda
- 20770 Paseo de la Rambla
- 5289 Via Andalusia
- 20709 Calle Pera
- 5795 Via Perla
- 20660 Calle Feliz
- 5317 Via Ramon Rd
- 4832 Via Frondosa
- 20520 Via Magdalena
- 4710 Avenida Del Este
- 5851 Via Santana
- 19862 Le Mans Cir
- 6191 Jacaranda Ln
- 20754 Tulip Cir
- 20681 Via Amarilla
- 21590 Via Pepita
- 5810 34 Via Romero
- 19831 Caprice Dr
- 19761 Burleigh Dr
- 20485 Via Calderon
- 5335 Via Azafran
- 5325 Via Azafran
- 5345 Via Azafran
- 20480 Via Castile
- 20490 Via Castile
- 20475 Via Calderon
- 20470 Via Castile
- 5315 Via Azafran
- 5355 Via Azafran
- 20490 Via Calderon
- 20480 Via Calderon
- 20465 Via Calderon
- 20460 Via Castile
- 5305 Via Azafran
- 20525 Via Campanas
- 5365 Via Azafran
- 20475 Via Castile
- 5360 Via Santander
- 20485 Via Cadiz