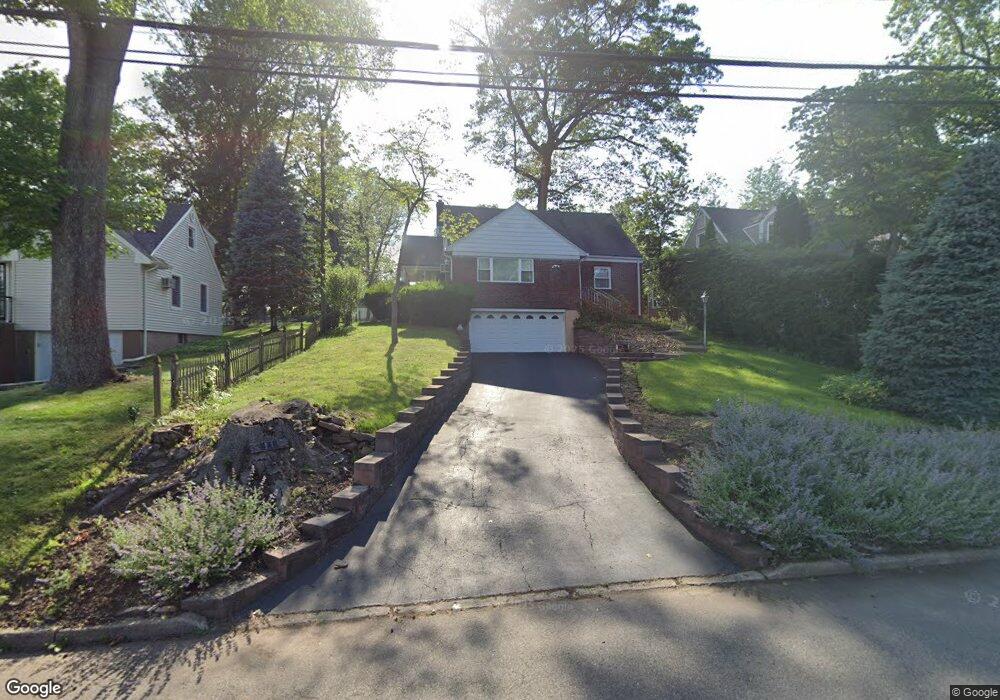
205 10th St Cresskill, NJ 07626
Estimated Value: $333,000 - $769,000
Studio
--
Bath
1,228
Sq Ft
$519/Sq Ft
Est. Value
About This Home
This home is located at 205 10th St, Cresskill, NJ 07626 and is currently estimated at $637,744, approximately $519 per square foot. 205 10th St is a home located in Bergen County with nearby schools including Cresskill High School and Spring School.
Ownership History
Date
Name
Owned For
Owner Type
Purchase Details
Closed on
Jun 23, 2025
Sold by
Seitz Karl and Seitz Lauren
Bought by
Seitz Lauren and Gorman William
Current Estimated Value
Home Financials for this Owner
Home Financials are based on the most recent Mortgage that was taken out on this home.
Original Mortgage
$410,000
Outstanding Balance
$408,964
Interest Rate
6.89%
Mortgage Type
New Conventional
Estimated Equity
$228,780
Purchase Details
Closed on
Mar 25, 2025
Sold by
Seitz Helga W and Seitz Martin O
Bought by
Seitz Karl and Seitz Lauren
Create a Home Valuation Report for This Property
The Home Valuation Report is an in-depth analysis detailing your home's value as well as a comparison with similar homes in the area
Home Values in the Area
Average Home Value in this Area
Purchase History
| Date | Buyer | Sale Price | Title Company |
|---|---|---|---|
| Seitz Lauren | $315,000 | Chicago Title Insurance Compan | |
| Seitz Lauren | $315,000 | Chicago Title Insurance Compan | |
| Seitz Karl | -- | None Listed On Document | |
| Seitz Karl | -- | None Listed On Document |
Source: Public Records
Mortgage History
| Date | Status | Borrower | Loan Amount |
|---|---|---|---|
| Open | Seitz Lauren | $410,000 |
Source: Public Records
Tax History
| Year | Tax Paid | Tax Assessment Tax Assessment Total Assessment is a certain percentage of the fair market value that is determined by local assessors to be the total taxable value of land and additions on the property. | Land | Improvement |
|---|---|---|---|---|
| 2025 | $10,943 | $521,100 | $386,000 | $135,100 |
| 2024 | $10,551 | $475,800 | $346,000 | $129,800 |
| 2023 | $10,237 | $454,600 | $328,500 | $126,100 |
| 2022 | $10,237 | $425,300 | $304,500 | $120,800 |
| 2021 | $9,337 | $414,100 | $297,000 | $117,100 |
| 2020 | $9,830 | $404,200 | $288,500 | $115,700 |
| 2019 | $9,611 | $399,300 | $285,000 | $114,300 |
| 2018 | $6,670 | $395,600 | $282,000 | $113,600 |
| 2017 | $8,713 | $320,100 | $204,000 | $116,100 |
| 2016 | $8,454 | $320,100 | $204,000 | $116,100 |
| 2015 | $8,191 | $320,100 | $204,000 | $116,100 |
| 2014 | $7,945 | $320,100 | $204,000 | $116,100 |
Source: Public Records
Map
Nearby Homes
- 206 10th St
- 292 Magnolia Ave
- 119 Stonegate Trail
- 136 Stonegate Trail Unit 37
- 17 Jefferson Ave
- 136 Elm St
- 40 5th St
- 170 Hickory Ave
- 51 Momar Dr
- 15 Dunn Place
- 7 Overlook Dr
- 126 Grant Ave
- 118 Sunset Ln
- 25 Division St Unit 403
- 17 Wight Place
- 181 Phelps Ave
- 168 4th St
- 36 Morningside Ave
- 196 Merritt Ave
- 40 Depew St
Your Personal Tour Guide
Ask me questions while you tour the home.