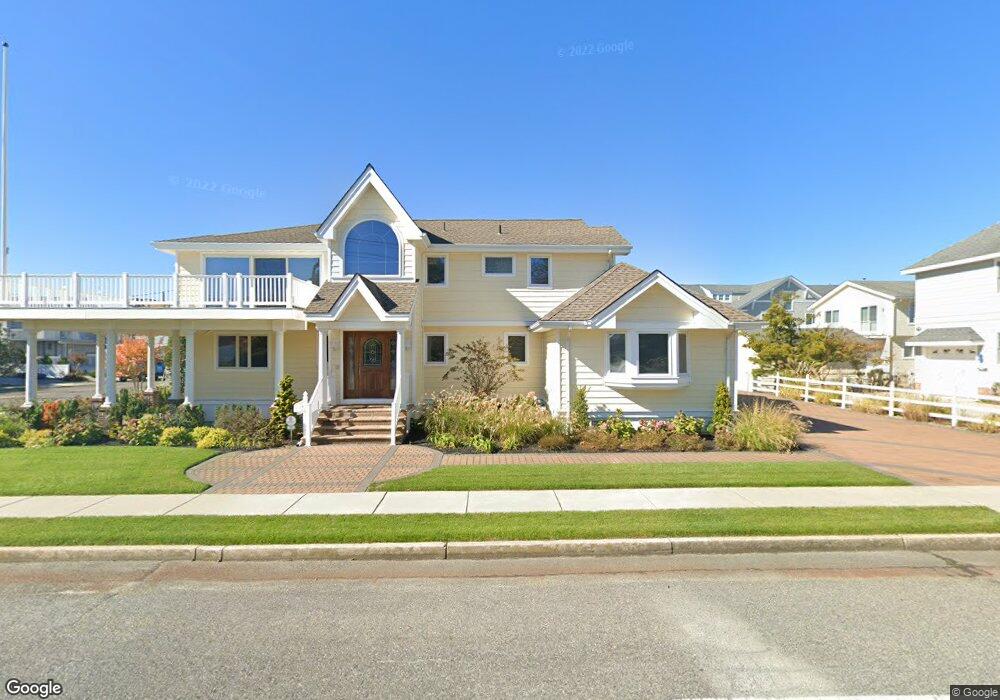
205 57th St Avalon, NJ 08202
Estimated Value: $4,016,000 - $4,719,000
Studio
--
Bath
3,372
Sq Ft
$1,280/Sq Ft
Est. Value
About This Home
This home is located at 205 57th St, Avalon, NJ 08202 and is currently estimated at $4,316,161, approximately $1,280 per square foot. 205 57th St is a home located in Cape May County with nearby schools including Avalon Elementary School.
Ownership History
Date
Name
Owned For
Owner Type
Purchase Details
Closed on
Dec 30, 2020
Sold by
Tornetta Kathleen
Bought by
Joseph F Tornetta Irt
Current Estimated Value
Purchase Details
Closed on
Jan 14, 2019
Sold by
Carluccio Carolyn
Bought by
Tornetta Kathleen
Purchase Details
Closed on
Jun 2, 2008
Sold by
Petrone Kathleen Tornetta
Bought by
Tornetta Kathleen and Carluccio Carolyn T
Purchase Details
Closed on
Jan 2, 1991
Sold by
Waxman Kathryn M
Bought by
Tornetta Charles J and Tornetta Dorothy S
Purchase Details
Closed on
Nov 3, 1988
Sold by
Waxman Earl
Bought by
Wasman Kathryn
Create a Home Valuation Report for This Property
The Home Valuation Report is an in-depth analysis detailing your home's value as well as a comparison with similar homes in the area
Home Values in the Area
Average Home Value in this Area
Purchase History
| Date | Buyer | Sale Price | Title Company |
|---|---|---|---|
| Joseph F Tornetta Irt | -- | None Available | |
| Tornetta Kathleen | $350,000 | Seaboard Title | |
| Tornetta Kathleen | -- | None Available | |
| Tornetta Kathleen | -- | None Available | |
| Tornetta Charles J | $475,000 | -- | |
| Wasman Kathryn | -- | -- |
Source: Public Records
Tax History Compared to Growth
Tax History
| Year | Tax Paid | Tax Assessment Tax Assessment Total Assessment is a certain percentage of the fair market value that is determined by local assessors to be the total taxable value of land and additions on the property. | Land | Improvement |
|---|---|---|---|---|
| 2025 | $10,903 | $1,775,700 | $1,266,600 | $509,100 |
| 2024 | $10,903 | $1,775,700 | $1,266,600 | $509,100 |
| 2023 | $10,814 | $1,775,700 | $1,266,600 | $509,100 |
| 2022 | $10,086 | $1,775,700 | $1,266,600 | $509,100 |
| 2021 | $9,056 | $1,775,700 | $1,266,600 | $509,100 |
| 2020 | $9,340 | $1,775,700 | $1,266,600 | $509,100 |
| 2019 | $9,056 | $1,775,700 | $1,266,600 | $509,100 |
| 2018 | $8,665 | $1,775,700 | $1,266,600 | $509,100 |
| 2017 | $8,581 | $1,543,400 | $1,033,300 | $510,100 |
| 2016 | $8,489 | $1,543,400 | $1,033,300 | $510,100 |
| 2015 | $8,350 | $1,543,400 | $1,033,300 | $510,100 |
| 2014 | $8,257 | $1,543,400 | $1,033,300 | $510,100 |
Source: Public Records
Map
Nearby Homes
- 5765 Ocean Dr
- 6229 Dune Dr
- 150 64th St
- 4640 Ocean Dr
- 6762 Ocean Dr Unit 6762
- 6772 Ocean Dr Unit 6772
- 4610 4th Ave
- 177 71st St
- 256 42nd St
- 264 41st St
- 7463 Ocean Dr
- 7800 Dune Dr Unit C205
- 7888 Dune Dr Unit 218
- 315 79th St Unit 315
- 253 35th St Unit WEST
- 280 79th St Unit 1
- 3429 Dune Dr
- 7929 Dune Dr Unit 212
- 301 80th St Unit B24
- 162 33rd St