205 Alpine Meadows Rd Unit 20 Alpine Meadows, CA 96146
Alpine Meadows NeighborhoodEstimated Value: $526,000 - $921,048
3
Beds
3
Baths
1,562
Sq Ft
$483/Sq Ft
Est. Value
About This Home
This home is located at 205 Alpine Meadows Rd Unit 20, Alpine Meadows, CA 96146 and is currently estimated at $755,012, approximately $483 per square foot. 205 Alpine Meadows Rd Unit 20 is a home located in Placer County with nearby schools including Tahoe Lake Elementary School, North Tahoe School, and North Tahoe High School.
Ownership History
Date
Name
Owned For
Owner Type
Purchase Details
Closed on
Aug 1, 2016
Sold by
Bahlo Tracey L
Bought by
Bahlo Tracey L
Current Estimated Value
Purchase Details
Closed on
May 26, 2009
Sold by
Bahlo Tracey L
Bought by
Bahlo Tracey L
Home Financials for this Owner
Home Financials are based on the most recent Mortgage that was taken out on this home.
Original Mortgage
$170,000
Outstanding Balance
$107,582
Interest Rate
4.8%
Mortgage Type
Stand Alone Refi Refinance Of Original Loan
Estimated Equity
$647,430
Purchase Details
Closed on
Mar 23, 2004
Sold by
Bahlo Thomas
Bought by
Bahlo Tracey L
Purchase Details
Closed on
Mar 18, 2004
Sold by
Lupton Patton H and Racoosin Patton L
Bought by
Bahlo Tracey L
Purchase Details
Closed on
Mar 4, 2002
Sold by
Racoosin Robert W
Bought by
Racoosin Patton Lupton and Hollowell Lupton Patton
Create a Home Valuation Report for This Property
The Home Valuation Report is an in-depth analysis detailing your home's value as well as a comparison with similar homes in the area
Home Values in the Area
Average Home Value in this Area
Purchase History
| Date | Buyer | Sale Price | Title Company |
|---|---|---|---|
| Bahlo Tracey L | -- | None Available | |
| Bahlo Tracey L | -- | Stewart Title Company | |
| Bahlo Tracey L | -- | Placer Title | |
| Bahlo Tracey L | $305,000 | Placer Title | |
| Racoosin Patton Lupton | -- | Placer Title |
Source: Public Records
Mortgage History
| Date | Status | Borrower | Loan Amount |
|---|---|---|---|
| Open | Bahlo Tracey L | $170,000 |
Source: Public Records
Tax History
| Year | Tax Paid | Tax Assessment Tax Assessment Total Assessment is a certain percentage of the fair market value that is determined by local assessors to be the total taxable value of land and additions on the property. | Land | Improvement |
|---|---|---|---|---|
| 2025 | $5,472 | $433,623 | $131,504 | $302,119 |
| 2023 | $5,472 | $416,788 | $126,399 | $290,389 |
| 2022 | $7,450 | $408,617 | $123,921 | $284,696 |
| 2021 | $7,132 | $400,606 | $121,492 | $279,114 |
| 2020 | $5,032 | $396,500 | $120,247 | $276,253 |
| 2019 | $5,076 | $388,727 | $117,890 | $270,837 |
| 2018 | $4,636 | $381,106 | $115,579 | $265,527 |
| 2017 | $4,548 | $373,634 | $113,313 | $260,321 |
| 2016 | $4,496 | $366,309 | $111,092 | $255,217 |
| 2015 | $4,407 | $360,808 | $109,424 | $251,384 |
| 2014 | $4,001 | $328,020 | $99,500 | $228,520 |
Source: Public Records
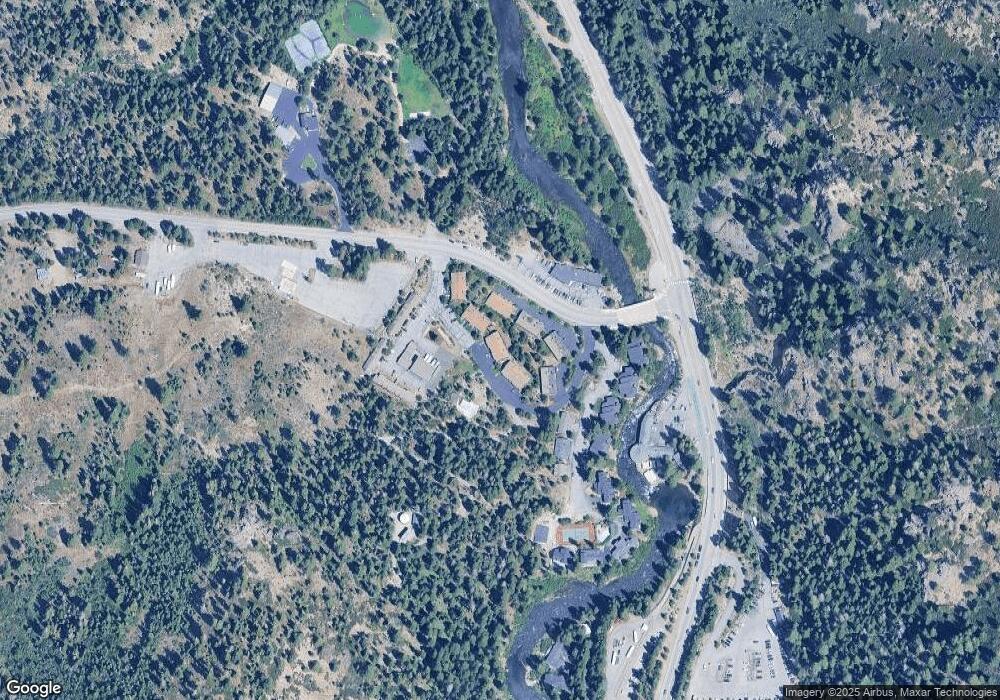
Map
Nearby Homes
- 135 Alpine Meadows Rd Unit 8
- 1018 Snow Crest Rd
- 1037 Snow Crest Rd
- 381 Sierra Crest Trail
- 1416 Mineral Springs Trail
- xxxxx Alpine Meadows Rd
- 3084 Mountain Links Way
- 1445 & 1451 Mineral Springs Trail
- 1456 Mineral Springs Trail
- 3122 Mountain Links Way
- 227 Olympic Valley Rd Unit 13
- 227 Olympic Valley Rd Unit 15
- 227 Olympic Valley Rd Unit 48
- 227 Olympic Valley Rd Unit 50
- 227 Olympic Valley Rd Unit 24
- 227 Olympic Valley Rd Unit 45
- 3058 Mountain Links Way
- 400 Squaw Creek Rd
- 400 + Resort Rd Unit 932
- 211 Palisades Cir Unit 2
- 205 Alpine Meadows Rd Unit 8
- 205 Alpine Meadows Rd Unit 7
- 205 Alpine Meadows Rd Unit 6
- 205 Alpine Meadows Rd Unit 10
- 205 Alpine Meadows Rd Unit 11
- 205 Alpine Meadows Rd Unit 12
- 205 Alpine Meadows Rd Unit 13
- 205 Alpine Meadows Rd Unit 14
- 205 Alpine Meadows Rd Unit 15
- 205 Alpine Meadows Rd Unit 16
- 205 Alpine Meadows Rd Unit 17
- 205 Alpine Meadows Rd Unit 18
- 205 Alpine Meadows Rd Unit 19
- 205 Alpine Meadows Rd Unit 21
- 205 Alpine Meadows Rd Unit 22
- 205 Alpine Meadows Rd Unit 5
- 205 Alpine Meadows Rd Unit 4
- 205 Alpine Meadows Rd Unit 3
- 205 Alpine Meadows Rd Unit 1
- 205 Alpine Meadows Rd Unit 23
Your Personal Tour Guide
Ask me questions while you tour the home.