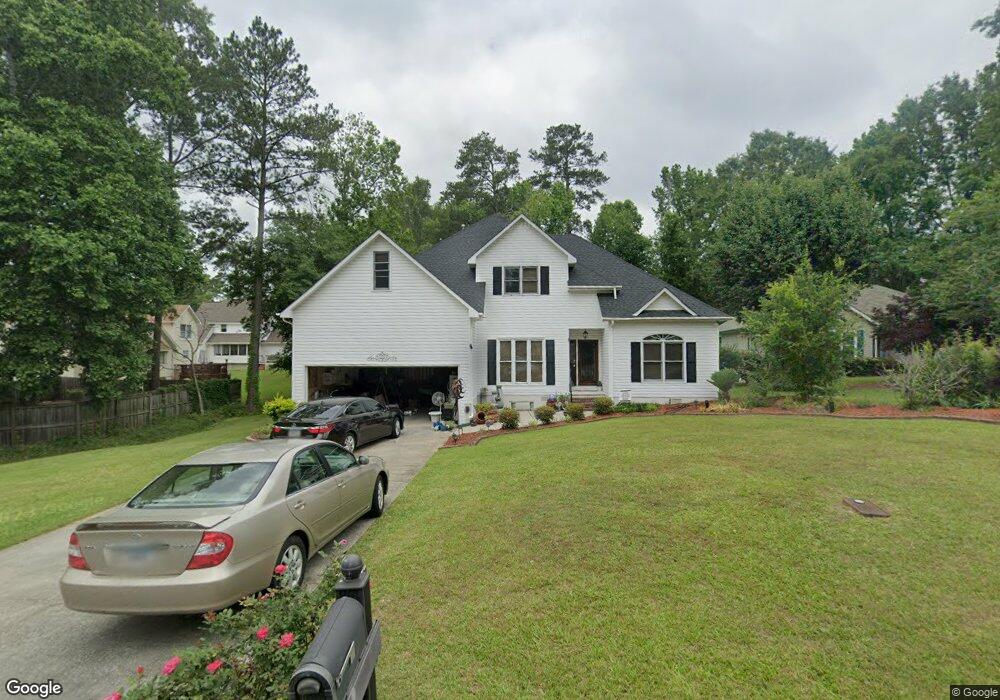
205 Ashford Ct Macon, GA 31210
Estimated Value: $239,683 - $274,000
3
Beds
3
Baths
1,883
Sq Ft
$139/Sq Ft
Est. Value
About This Home
This home is located at 205 Ashford Ct, Macon, GA 31210 and is currently estimated at $262,171, approximately $139 per square foot. 205 Ashford Ct is a home located in Bibb County with nearby schools including Carter Elementary School, Howard Middle School, and Howard High School.
Ownership History
Date
Name
Owned For
Owner Type
Purchase Details
Closed on
Aug 26, 2013
Sold by
Khan Attiya
Bought by
Khan Attiya and Khan Nassib
Current Estimated Value
Home Financials for this Owner
Home Financials are based on the most recent Mortgage that was taken out on this home.
Original Mortgage
$124,400
Outstanding Balance
$30,023
Interest Rate
4.31%
Mortgage Type
New Conventional
Estimated Equity
$232,148
Purchase Details
Closed on
Feb 21, 2012
Sold by
Khan Nassib Ahmad
Bought by
Khan Attiya
Purchase Details
Closed on
Feb 14, 2012
Sold by
Khan Nassib A
Bought by
Khan Attiya
Purchase Details
Closed on
Dec 9, 2005
Sold by
Poupard David G and Poupard Lynnette A
Bought by
Khan Nassib Ahmad
Home Financials for this Owner
Home Financials are based on the most recent Mortgage that was taken out on this home.
Original Mortgage
$134,400
Interest Rate
6.23%
Mortgage Type
New Conventional
Purchase Details
Closed on
Jul 26, 2002
Purchase Details
Closed on
Jan 13, 1998
Create a Home Valuation Report for This Property
The Home Valuation Report is an in-depth analysis detailing your home's value as well as a comparison with similar homes in the area
Home Values in the Area
Average Home Value in this Area
Purchase History
| Date | Buyer | Sale Price | Title Company |
|---|---|---|---|
| Khan Attiya | -- | None Available | |
| Khan Attiya | -- | None Available | |
| Khan Attiya | -- | None Available | |
| Khan Nassib Ahmad | $168,000 | None Available | |
| -- | $148,400 | -- | |
| -- | $140,000 | -- |
Source: Public Records
Mortgage History
| Date | Status | Borrower | Loan Amount |
|---|---|---|---|
| Open | Khan Attiya | $124,400 | |
| Closed | Khan Nassib Ahmad | $134,400 |
Source: Public Records
Tax History Compared to Growth
Tax History
| Year | Tax Paid | Tax Assessment Tax Assessment Total Assessment is a certain percentage of the fair market value that is determined by local assessors to be the total taxable value of land and additions on the property. | Land | Improvement |
|---|---|---|---|---|
| 2025 | $2,006 | $88,648 | $12,000 | $76,648 |
| 2024 | $1,749 | $75,874 | $12,000 | $63,874 |
| 2023 | $1,292 | $75,874 | $12,000 | $63,874 |
| 2022 | $2,109 | $67,928 | $8,800 | $59,128 |
| 2021 | $1,983 | $59,178 | $8,000 | $51,178 |
| 2020 | $2,026 | $59,178 | $8,000 | $51,178 |
| 2019 | $2,043 | $59,178 | $8,000 | $51,178 |
| 2018 | $3,308 | $59,178 | $8,000 | $51,178 |
| 2017 | $1,712 | $52,699 | $8,000 | $44,699 |
| 2016 | $1,581 | $52,699 | $8,000 | $44,699 |
| 2015 | $2,482 | $57,666 | $8,000 | $49,666 |
| 2014 | $2,242 | $52,699 | $8,000 | $44,699 |
Source: Public Records
Map
Nearby Homes
- 139 Ashford Trace Ln
- 200 Autumn Trace Ct
- 180 Autumn Trace Ct
- 103 Hanover Place
- 118 Ashford Park
- 131 Ashford Park
- 106 Trillium Terrace
- 200 Stone Edge Rd
- 1154 N Plantation Pkwy
- 218 Matlock Ln
- 1137 N Plantation Pkwy
- 210 Jefferson Park Dr
- 959 S Confederate Dr
- 363 Jefferson Park Dr
- 900 S Plantation Pkwy
- 221 Jefferson Cir
- 260 Edgewater Dr
- 1069 Greentree Pkwy
- 378 Fox Tail Dr
- 1181 Sandy Beach Dr
- 209 Ashford Ct
- 117 Ashford Trace Ln
- 113 Ashford Trace Ln
- 213 Ashford Ct
- 127 Ashford Trace Ln
- 109 Ashford Trace Ln
- 1082 Ashford Chase Ct
- 1076 Ashford Chase Ct
- 217 Ashford Ct
- 1086 Ashford Chase Ct
- 204 Ashford Ct
- 131 Ashford Trace Ln
- 208 Ashford Ct
- 105 Ashford Trace Ln
- 1072 Ashford Chase Ct
- 135 Ashford Trace Ln
- 120 Ashford Trace Ln
- 124 Ashford Trace Ln
- 1090 Ashford Chase Ct
- 116 Ashford Trace Ln