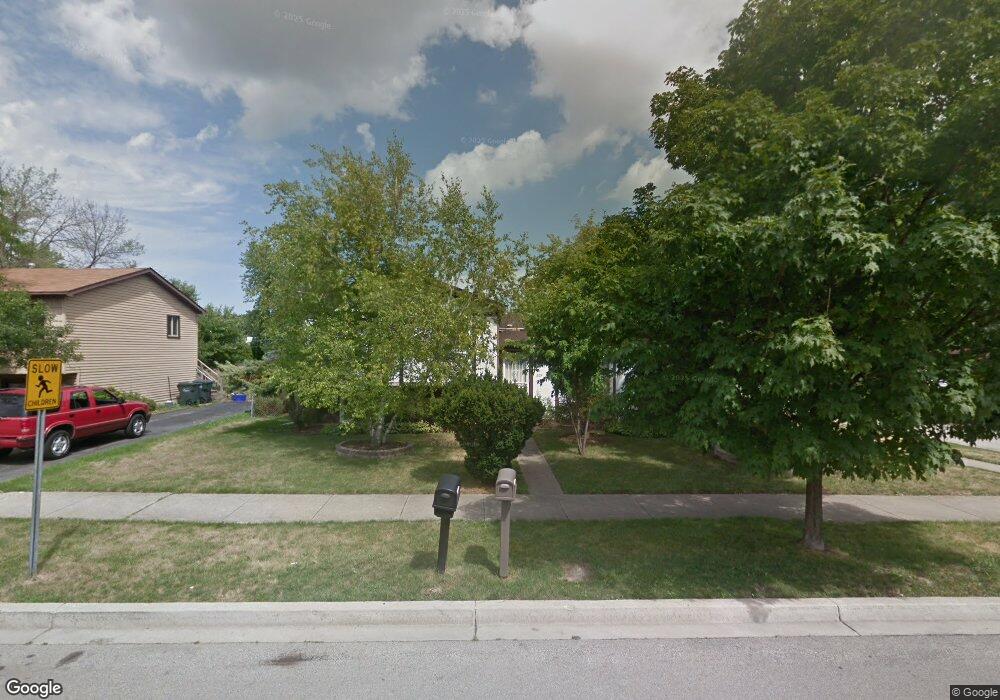
205 Baldwin Ave Waukegan, IL 60085
Washington Hills NeighborhoodEstimated Value: $231,000 - $274,000
3
Beds
1
Bath
982
Sq Ft
$266/Sq Ft
Est. Value
About This Home
This home is located at 205 Baldwin Ave, Waukegan, IL 60085 and is currently estimated at $260,899, approximately $265 per square foot. 205 Baldwin Ave is a home located in Lake County with nearby schools including Whittier Elementary School, Robert E. Abbott Middle School, and Waukegan High School.
Ownership History
Date
Name
Owned For
Owner Type
Purchase Details
Closed on
Dec 16, 2004
Sold by
Gonzalez Jose
Bought by
Gonzalez Jose and Gonzalez Arminda
Current Estimated Value
Home Financials for this Owner
Home Financials are based on the most recent Mortgage that was taken out on this home.
Original Mortgage
$151,200
Outstanding Balance
$85,163
Interest Rate
7.65%
Mortgage Type
Stand Alone Refi Refinance Of Original Loan
Estimated Equity
$175,736
Purchase Details
Closed on
Apr 29, 1997
Sold by
Villarreal Rogelio M and Villarreal Sandra L
Bought by
Gonzalez Jose and Gonzalez Arminda
Home Financials for this Owner
Home Financials are based on the most recent Mortgage that was taken out on this home.
Original Mortgage
$113,950
Interest Rate
8.05%
Mortgage Type
FHA
Purchase Details
Closed on
Nov 23, 1993
Sold by
American Natl Bk & Tr Co Of Waukegan
Bought by
Villarreal Rogelio M and Villarreal Sandra L
Home Financials for this Owner
Home Financials are based on the most recent Mortgage that was taken out on this home.
Original Mortgage
$90,000
Interest Rate
6.82%
Mortgage Type
FHA
Create a Home Valuation Report for This Property
The Home Valuation Report is an in-depth analysis detailing your home's value as well as a comparison with similar homes in the area
Home Values in the Area
Average Home Value in this Area
Purchase History
| Date | Buyer | Sale Price | Title Company |
|---|---|---|---|
| Gonzalez Jose | -- | Lawyers | |
| Gonzalez Jose | $115,000 | -- | |
| Villarreal Rogelio M | -- | -- |
Source: Public Records
Mortgage History
| Date | Status | Borrower | Loan Amount |
|---|---|---|---|
| Open | Gonzalez Jose | $151,200 | |
| Closed | Gonzalez Jose | $113,950 | |
| Previous Owner | Villarreal Rogelio M | $90,000 |
Source: Public Records
Tax History Compared to Growth
Tax History
| Year | Tax Paid | Tax Assessment Tax Assessment Total Assessment is a certain percentage of the fair market value that is determined by local assessors to be the total taxable value of land and additions on the property. | Land | Improvement |
|---|---|---|---|---|
| 2024 | $4,383 | $69,790 | $14,304 | $55,486 |
| 2023 | $4,984 | $62,482 | $12,806 | $49,676 |
| 2022 | $4,984 | $61,980 | $11,798 | $50,182 |
| 2021 | $4,424 | $53,435 | $10,080 | $43,355 |
| 2020 | $3,067 | $49,781 | $9,391 | $40,390 |
| 2019 | $3,323 | $45,616 | $8,605 | $37,011 |
| 2018 | $4,075 | $43,010 | $11,072 | $31,938 |
| 2017 | $4,559 | $38,052 | $9,796 | $28,256 |
| 2016 | $4,182 | $33,065 | $8,512 | $24,553 |
| 2015 | $3,985 | $29,593 | $7,618 | $21,975 |
| 2014 | $3,419 | $25,750 | $8,500 | $17,250 |
| 2012 | $4,458 | $27,897 | $9,208 | $18,689 |
Source: Public Records
Map
Nearby Homes
- 102 Baldwin Ave
- 24 Washington Terrace
- 0 Brookside Ave
- 3170 W Monroe St Unit 309
- 621 N Austin Ave
- 34887 N Austin Ave
- 603 N Austin Ave
- 2115 Lydia St
- 2726 W Hidden Glen Dr
- 615 Tiffany Dr
- 525 Lawrence Ave
- 12698 W Grandview Ave
- 12716 W Grandview Ave
- 12601 W Atlantic Ave
- 2116 & 2101 Williamsburg Dr
- 49 S Lewis Ave
- 3210 W Grandview Ave
- 1213 Grand Ave
- 3482 Ellis Ave
- 132 Dorchester Ct
- 209 Baldwin Ave
- 215 Baldwin Ave
- 200 N Metropolitan Ave
- 123 Baldwin Ave
- 202 N Metropolitan Ave
- 124 N Metropolitan Ave
- 204 N Metropolitan Ave
- 200 Baldwin Ave
- 219 Baldwin Ave
- 202 Baldwin Ave
- 122 N Metropolitan Ave
- 119 Baldwin Ave
- 122 Baldwin Ave
- 204 Baldwin Ave
- 206 N Metropolitan Ave
- 118 N Metropolitan Ave
- 223 Baldwin Ave
- 120 Baldwin Ave
- 117 Baldwin Ave
- 206 Baldwin Ave