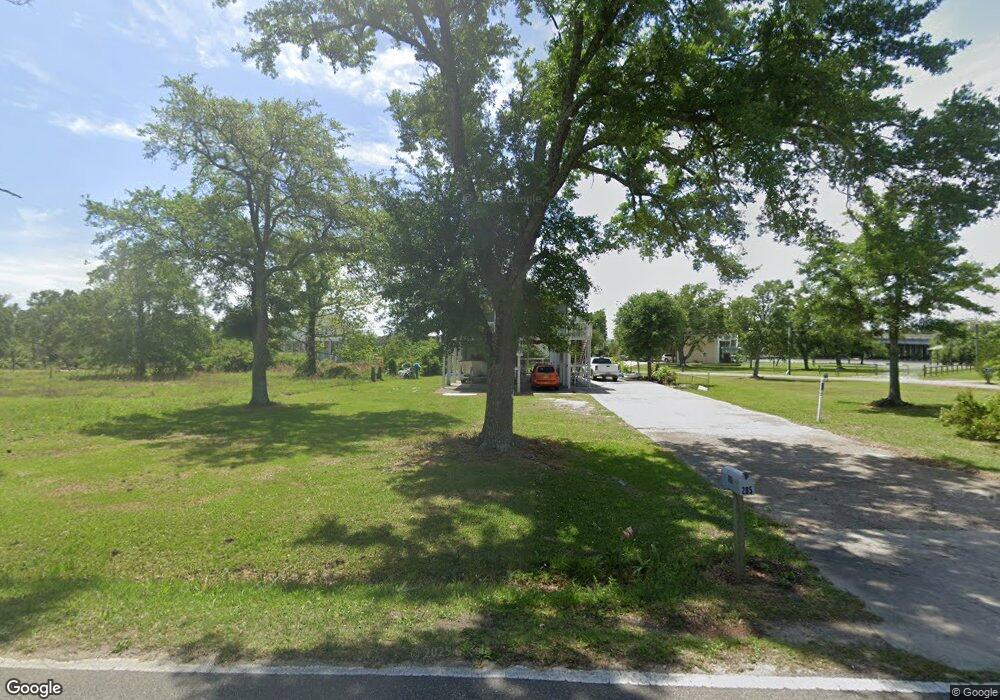
205 Bayview St Pass Christian, MS 39571
Estimated Value: $264,056 - $351,000
3
Beds
2
Baths
1,300
Sq Ft
$223/Sq Ft
Est. Value
About This Home
This home is located at 205 Bayview St, Pass Christian, MS 39571 and is currently estimated at $290,514, approximately $223 per square foot. 205 Bayview St is a home located in Harrison County with nearby schools including Pass Christian High School, Holy Trinity Catholic School, and Central Christian Academy.
Ownership History
Date
Name
Owned For
Owner Type
Purchase Details
Closed on
Oct 24, 2022
Sold by
Nguyen Phuong Thi Thuy
Bought by
Nguyen Phuong Thi Thuy and Tran Nguyen Thithuy
Current Estimated Value
Purchase Details
Closed on
Aug 27, 2021
Sold by
Faison Jarrell Michelle
Bought by
Gmc Enterprises Llc
Purchase Details
Closed on
Feb 19, 2020
Sold by
Nguyen Thuong and Tran Nga T
Bought by
Nguyen Phuong T
Purchase Details
Closed on
Mar 18, 2019
Sold by
Nguyen Thuong and Nguyen Nga
Bought by
Nguyen Thuong and Nguyen Nga
Create a Home Valuation Report for This Property
The Home Valuation Report is an in-depth analysis detailing your home's value as well as a comparison with similar homes in the area
Home Values in the Area
Average Home Value in this Area
Purchase History
| Date | Buyer | Sale Price | Title Company |
|---|---|---|---|
| Nguyen Phuong Thi Thuy | -- | None Listed On Document | |
| Gmc Enterprises Llc | -- | None Listed On Document | |
| Nguyen Phuong T | -- | None Available | |
| Nguyen Thuong | -- | -- |
Source: Public Records
Tax History Compared to Growth
Tax History
| Year | Tax Paid | Tax Assessment Tax Assessment Total Assessment is a certain percentage of the fair market value that is determined by local assessors to be the total taxable value of land and additions on the property. | Land | Improvement |
|---|---|---|---|---|
| 2025 | $843 | $11,378 | $0 | $0 |
| 2024 | $843 | $10,845 | $0 | $0 |
| 2023 | $843 | $10,845 | $0 | $0 |
| 2022 | $843 | $10,845 | $0 | $0 |
| 2021 | $860 | $10,845 | $0 | $0 |
| 2020 | $849 | $10,555 | $0 | $0 |
| 2019 | $849 | $10,555 | $0 | $0 |
| 2018 | $843 | $10,555 | $0 | $0 |
| 2017 | $841 | $10,498 | $0 | $0 |
| 2015 | $1,671 | $15,312 | $0 | $0 |
| 2014 | -- | $16,260 | $0 | $0 |
| 2013 | -- | $10,208 | $949 | $9,259 |
Source: Public Records
Map
Nearby Homes