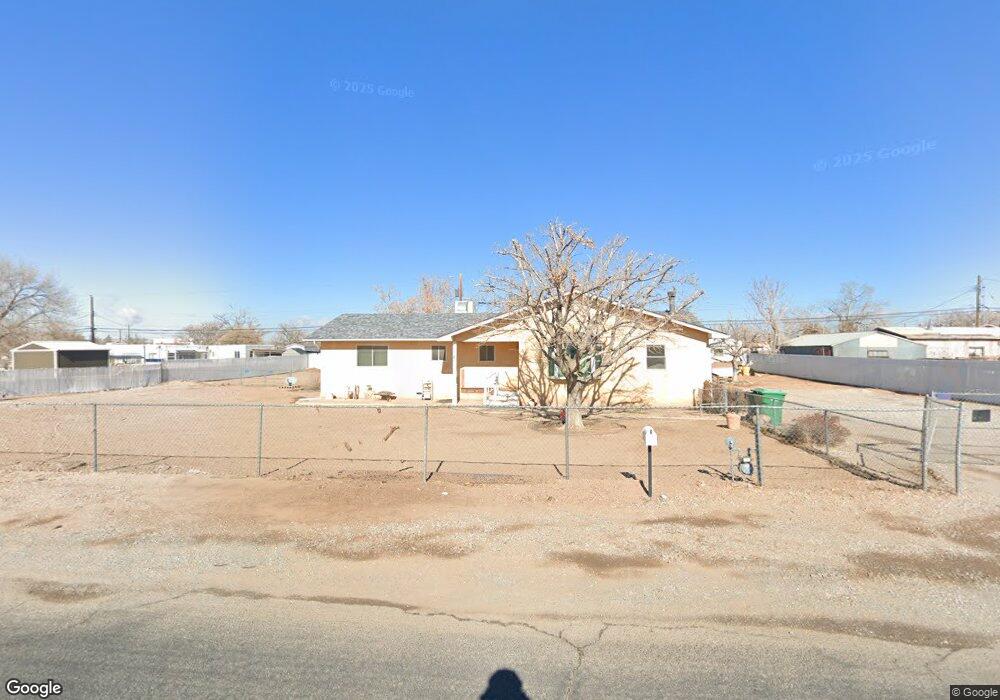
205 Camino Tres SW Albuquerque, NM 87105
Estimated Value: $327,363 - $387,000
3
Beds
2
Baths
1,833
Sq Ft
$196/Sq Ft
Est. Value
About This Home
This home is located at 205 Camino Tres SW, Albuquerque, NM 87105 and is currently estimated at $359,591, approximately $196 per square foot. 205 Camino Tres SW is a home located in Bernalillo County with nearby schools including Mountain View Elementary School, Polk Middle School, and Rio Grande High School.
Ownership History
Date
Name
Owned For
Owner Type
Purchase Details
Closed on
Jun 10, 2019
Sold by
Mccracken Darla J
Bought by
Mccracken Jeffrey S
Current Estimated Value
Purchase Details
Closed on
Jun 8, 2012
Sold by
Mccracken Jeffery S
Bought by
Mccracken Darla J and Mccracken Jeffery S
Home Financials for this Owner
Home Financials are based on the most recent Mortgage that was taken out on this home.
Original Mortgage
$85,000
Interest Rate
3.86%
Mortgage Type
New Conventional
Purchase Details
Closed on
Jul 26, 1999
Sold by
Mccracken Jeffrey S and Mccracken Darla J
Bought by
Mccracken Jeffery S
Home Financials for this Owner
Home Financials are based on the most recent Mortgage that was taken out on this home.
Original Mortgage
$93,750
Interest Rate
7.63%
Purchase Details
Closed on
Jun 10, 1998
Sold by
Mccracken Jeffrey S and Mccracken Darla J
Bought by
Mccracken Jeffery S and Mccracken Darla J
Create a Home Valuation Report for This Property
The Home Valuation Report is an in-depth analysis detailing your home's value as well as a comparison with similar homes in the area
Home Values in the Area
Average Home Value in this Area
Purchase History
| Date | Buyer | Sale Price | Title Company |
|---|---|---|---|
| Mccracken Jeffrey S | -- | None Available | |
| Mccracken Darla J | -- | Fidelity National Title Nm | |
| Mccracken Jeffery S | -- | Fidelity National Title Ins | |
| Mccracken Jeffery S | -- | -- |
Source: Public Records
Mortgage History
| Date | Status | Borrower | Loan Amount |
|---|---|---|---|
| Closed | Mccracken Darla J | $85,000 | |
| Closed | Mccracken Jeffery S | $93,750 | |
| Closed | Mccracken Jeffery S | $18,750 |
Source: Public Records
Tax History Compared to Growth
Tax History
| Year | Tax Paid | Tax Assessment Tax Assessment Total Assessment is a certain percentage of the fair market value that is determined by local assessors to be the total taxable value of land and additions on the property. | Land | Improvement |
|---|---|---|---|---|
| 2024 | $1,096 | $37,315 | $11,013 | $26,302 |
| 2023 | $1,077 | $36,228 | $10,692 | $25,536 |
| 2022 | $1,039 | $35,174 | $10,381 | $24,793 |
| 2021 | $1,002 | $34,149 | $10,078 | $24,071 |
| 2020 | $985 | $33,155 | $9,785 | $23,370 |
| 2019 | $954 | $32,189 | $9,500 | $22,689 |
| 2018 | $918 | $32,189 | $9,500 | $22,689 |
| 2017 | $887 | $31,251 | $9,223 | $22,028 |
| 2016 | $858 | $29,458 | $8,694 | $20,764 |
| 2015 | $28,601 | $28,601 | $8,441 | $20,160 |
| 2014 | $799 | $27,769 | $8,196 | $19,573 |
| 2013 | -- | $26,960 | $7,957 | $19,003 |
Source: Public Records
Map
Nearby Homes
- 5304 Southfort SW
- 301 Shirk Ln SW
- 5707 Industry Way SE
- 5016 5th St SW
- 312 Shirk Ln SW
- 425 Shirk Ln SW
- 535 Cacahuate SW
- 1431 Tierra Verde Place SW
- 1743 Antone Loop Rd SW
- 4307 Wallace St SE
- 4303 Kennard Ave SE
- 4312 March St SE
- 308 Gore Ave SE
- 4625 Sunny Cir SW
- 1905 Lakeview Rd SW
- 3742 Isleta Blvd SW
- 2212 Henry Rd SW
- 4001 Donald Rd SW
- 712 Salida Sandia SW
- 3641 Cameo Dr SE
- 201 Camino Tres SW
- 130 Camino Dos SW
- 159 Camino Tres SW
- 120 Camino Dos SW
- 212 Camino Dos SW
- 102 Camino Dos SW
- 153 Camino Don Thomas
- 113 Camino Dos SW
- 213 Camino Tres SW
- 216 Camino Dos SW
- 205 Camino Cuatro SW
- 117 Camino Dos SW
- 101 Camino Dos SW
- 213 Camino Dos SW
- 217 Camino Tres SW
- 217 Camino Dos SW
- 216 Camino Tres SW
- 220 Camino Dos SW
- 208 Camino Uno SW
- 212 Camino Uno SW