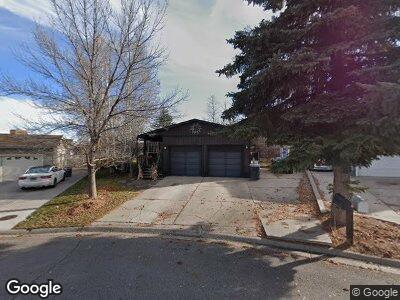
205 Cherokee Ct Evanston, WY 82930
Estimated Value: $311,000 - $440,000
4
Beds
2
Baths
1,836
Sq Ft
$192/Sq Ft
Est. Value
About This Home
This home is located at 205 Cherokee Ct, Evanston, WY 82930 and is currently estimated at $352,362, approximately $191 per square foot. 205 Cherokee Ct is a home located in Uinta County with nearby schools including Evanston High School and Evanston Child Development Center.
Ownership History
Date
Name
Owned For
Owner Type
Purchase Details
Closed on
Oct 22, 2021
Sold by
Olivas Jose M and Olivas Anna E
Bought by
Olivas Jose M and Olivas Anna E
Current Estimated Value
Home Financials for this Owner
Home Financials are based on the most recent Mortgage that was taken out on this home.
Original Mortgage
$200,000
Outstanding Balance
$186,293
Interest Rate
2.8%
Mortgage Type
New Conventional
Estimated Equity
$122,166
Purchase Details
Closed on
Feb 26, 2021
Sold by
Olivas Jose M and Pacheco Anna E
Bought by
Olivas Jose M and Olivas Anna E
Purchase Details
Closed on
Oct 13, 2006
Sold by
Chambers Troy A and Samantha Chambers M
Bought by
Olivas Jose M and Pacheco Anna E
Home Financials for this Owner
Home Financials are based on the most recent Mortgage that was taken out on this home.
Original Mortgage
$7,770
Interest Rate
6.44%
Mortgage Type
Stand Alone Second
Create a Home Valuation Report for This Property
The Home Valuation Report is an in-depth analysis detailing your home's value as well as a comparison with similar homes in the area
Home Values in the Area
Average Home Value in this Area
Purchase History
| Date | Buyer | Sale Price | Title Company |
|---|---|---|---|
| Olivas Jose M | -- | First American Title Ins Co | |
| Olivas Jose M | -- | None Available | |
| Olivas Jose M | -- | None Available |
Source: Public Records
Mortgage History
| Date | Status | Borrower | Loan Amount |
|---|---|---|---|
| Open | Olivas Jose M | $200,000 | |
| Closed | Olivas Jose M | $7,770 | |
| Closed | Pacheco Anna E | $144,728 |
Source: Public Records
Tax History Compared to Growth
Tax History
| Year | Tax Paid | Tax Assessment Tax Assessment Total Assessment is a certain percentage of the fair market value that is determined by local assessors to be the total taxable value of land and additions on the property. | Land | Improvement |
|---|---|---|---|---|
| 2024 | $1,622 | $23,862 | $4,484 | $19,378 |
| 2023 | $1,549 | $22,899 | $4,265 | $18,634 |
| 2022 | $1,405 | $20,645 | $2,463 | $18,182 |
| 2021 | $1,188 | $17,422 | $2,463 | $14,959 |
| 2020 | $1,023 | $15,017 | $2,243 | $12,774 |
| 2019 | $1,041 | $15,305 | $2,097 | $13,208 |
| 2018 | $0 | $14,133 | $2,139 | $11,994 |
| 2017 | $949 | $13,970 | $2,139 | $11,831 |
| 2016 | $926 | $13,611 | $1,878 | $11,733 |
| 2015 | -- | $13,364 | $1,619 | $11,745 |
| 2014 | -- | $12,516 | $1,406 | $11,110 |
Source: Public Records
Map
Nearby Homes