Estimated Value: $272,000 - $283,000
3
Beds
2
Baths
2,160
Sq Ft
$128/Sq Ft
Est. Value
About This Home
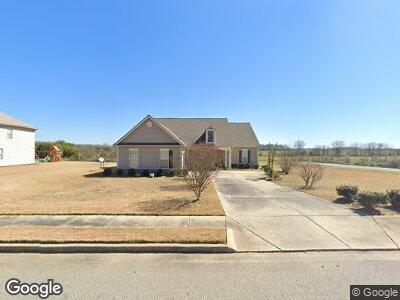
This home is located at 205 Cumberland Dr, Byron, GA 31008 and is currently estimated at $276,359, approximately $127 per square foot. 205 Cumberland Dr is a home located in Peach County with nearby schools including Byron Elementary School, Byron Middle School, and Peach County High School.
Ownership History
Date
Name
Owned For
Owner Type
Purchase Details
Closed on
Jul 30, 2008
Sold by
D R Horton Inc
Bought by
Taylor David L
Current Estimated Value
Home Financials for this Owner
Home Financials are based on the most recent Mortgage that was taken out on this home.
Original Mortgage
$167,526
Interest Rate
6.31%
Mortgage Type
New Conventional
Purchase Details
Closed on
Jul 18, 2008
Bought by
D R Horton Inc
Home Financials for this Owner
Home Financials are based on the most recent Mortgage that was taken out on this home.
Original Mortgage
$167,526
Interest Rate
6.31%
Mortgage Type
New Conventional
Purchase Details
Closed on
Mar 13, 2008
Sold by
Cumberland Shores Llc
Bought by
D R Horton Inc
Purchase Details
Closed on
Feb 22, 2005
Sold by
Vinson Jr Edgar Keith and Vinson Jr Robert Grayden
Bought by
Cumberland Shores Llc
Purchase Details
Closed on
Jan 3, 2003
Sold by
Vinson Edgar Keith and Robert Grayden
Bought by
Cumberland Shores Llc
Create a Home Valuation Report for This Property
The Home Valuation Report is an in-depth analysis detailing your home's value as well as a comparison with similar homes in the area
Home Values in the Area
Average Home Value in this Area
Purchase History
| Date | Buyer | Sale Price | Title Company |
|---|---|---|---|
| Taylor David L | $164,700 | -- | |
| D R Horton Inc | -- | -- | |
| D R Horton Inc | -- | -- | |
| Cumberland Shores Llc | -- | -- | |
| Cumberland Shores Llc | -- | -- |
Source: Public Records
Mortgage History
| Date | Status | Borrower | Loan Amount |
|---|---|---|---|
| Open | Taylor David L | $134,317 | |
| Closed | Taylor David L | $154,569 | |
| Closed | Taylor David L | $167,526 |
Source: Public Records
Tax History Compared to Growth
Tax History
| Year | Tax Paid | Tax Assessment Tax Assessment Total Assessment is a certain percentage of the fair market value that is determined by local assessors to be the total taxable value of land and additions on the property. | Land | Improvement |
|---|---|---|---|---|
| 2024 | $3,679 | $104,600 | $13,720 | $90,880 |
| 2023 | $3,580 | $101,160 | $11,000 | $90,160 |
| 2022 | $2,371 | $90,080 | $11,000 | $79,080 |
| 2021 | $2,249 | $74,040 | $8,800 | $65,240 |
| 2020 | $1,933 | $63,920 | $8,800 | $55,120 |
| 2019 | $1,943 | $63,920 | $8,800 | $55,120 |
| 2018 | $1,953 | $63,920 | $8,800 | $55,120 |
| 2017 | $1,962 | $63,920 | $8,800 | $55,120 |
| 2016 | $1,954 | $63,920 | $8,800 | $55,120 |
| 2015 | $1,957 | $63,920 | $8,800 | $55,120 |
| 2014 | $1,960 | $63,920 | $8,800 | $55,120 |
| 2013 | -- | $63,920 | $8,800 | $55,120 |
Source: Public Records
Map
Nearby Homes
- 107 Coastal Ct
- 0 Peavy Rd
- 137 Amber Dr
- 109 Manchester Ln
- 158 Old Hickory Rd
- 115 Darin Dr
- 427 Lamplight Dr
- 136 Old Hickory Rd
- 217 Caleb Way
- 412 Lamplight Dr
- 102 Caleb Way
- 228 Hanover Dr
- 126 Monroe Ct
- 712 Georgian Walk
- 707 Georgian Walk
- 700 Georgian Walk
- 605 Georgian Walk
- 609 Georgian Walk
- 606 Georgian Walk
- 706 Georgian Walk
- 205 Cumberland Dr
- 207 Cumberland Dr
- 203 Cumberland Dr
- 202 Cumberland Drive(23)
- 209 Cumberland Dr (10)
- 201 Cumberland Dr
- 204 Cumberland Dr
- 202 Cumberland Dr
- 206 Cumberland Dr
- 101 Christopher Dr
- 209 Cumberland Dr
- 159 Cumberland Dr
- 208 Cumberland Dr(20)
- 208 Cumberland Dr
- 0 Cumberland Dr Unit 7349351
- 0 Cumberland Dr Unit 7324805
- 0 Cumberland Dr Unit 7286951
- 0 Cumberland Dr Unit 8889731
- 0 Cumberland Dr Unit 8633088
- 0 Cumberland Dr Unit 8578293