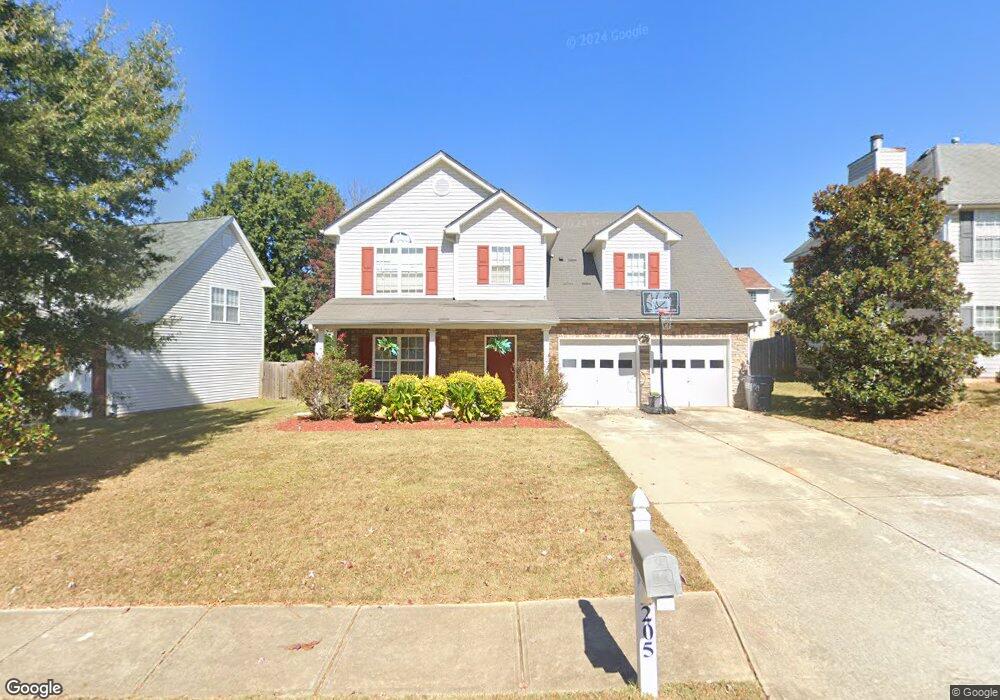
205 Dairyland Dr Covington, GA 30016
Estimated Value: $287,409 - $324,000
4
Beds
3
Baths
2,084
Sq Ft
$144/Sq Ft
Est. Value
About This Home
This home is located at 205 Dairyland Dr, Covington, GA 30016 and is currently estimated at $299,352, approximately $143 per square foot. 205 Dairyland Dr is a home located in Newton County with nearby schools including West Newton Elementary School, Veterans Memorial Middle School, and Alcovy High School.
Ownership History
Date
Name
Owned For
Owner Type
Purchase Details
Closed on
Dec 22, 2014
Sold by
Vanhalteren David
Bought by
Vangood Holdings Lllp
Current Estimated Value
Purchase Details
Closed on
Oct 19, 2012
Sold by
Dreihaupi Marc
Bought by
Vanhalteren David and Goodwin Elizabeth
Purchase Details
Closed on
Dec 27, 2011
Sold by
Residenial Funding Real Es
Bought by
Dreihaupl Marc and Hann Katrina
Purchase Details
Closed on
Sep 6, 2011
Sold by
Bowman Bertie B
Bought by
Residenial Funding Real Estate
Purchase Details
Closed on
Jan 10, 2003
Sold by
Greenwood Hms Inc
Bought by
Bowman Bertie B and Bowman Theresa
Home Financials for this Owner
Home Financials are based on the most recent Mortgage that was taken out on this home.
Original Mortgage
$101,918
Interest Rate
8.38%
Mortgage Type
New Conventional
Create a Home Valuation Report for This Property
The Home Valuation Report is an in-depth analysis detailing your home's value as well as a comparison with similar homes in the area
Home Values in the Area
Average Home Value in this Area
Purchase History
| Date | Buyer | Sale Price | Title Company |
|---|---|---|---|
| Vangood Holdings Lllp | -- | -- | |
| Vanhalteren David | $79,900 | -- | |
| Dreihaupl Marc | $49,500 | -- | |
| Residenial Funding Real Estate | $42,000 | -- | |
| Bowman Bertie B | $124,900 | -- |
Source: Public Records
Mortgage History
| Date | Status | Borrower | Loan Amount |
|---|---|---|---|
| Previous Owner | Bowman Bertie B | $101,918 |
Source: Public Records
Tax History Compared to Growth
Tax History
| Year | Tax Paid | Tax Assessment Tax Assessment Total Assessment is a certain percentage of the fair market value that is determined by local assessors to be the total taxable value of land and additions on the property. | Land | Improvement |
|---|---|---|---|---|
| 2024 | $2,778 | $108,120 | $6,022 | $102,098 |
| 2023 | $2,973 | $108,120 | $6,022 | $102,098 |
| 2022 | $2,973 | $108,120 | $6,800 | $101,320 |
| 2021 | $1,843 | $59,480 | $6,754 | $52,726 |
| 2020 | $2,082 | $59,480 | $6,754 | $52,726 |
| 2019 | $2,113 | $59,480 | $6,800 | $52,680 |
| 2018 | $1,883 | $52,400 | $7,400 | $45,000 |
| 2017 | $1,865 | $51,880 | $6,600 | $45,280 |
| 2016 | $1,861 | $51,760 | $3,800 | $47,960 |
| 2015 | $1,232 | $33,440 | $3,400 | $30,040 |
| 2014 | $964 | $25,720 | $0 | $0 |
Source: Public Records
Map
Nearby Homes
- 190 Timberlake Terrace
- 25 Franklin Way
- 100 Adelaide Dr
- 330 Greenway Dr
- 55 Emerson Trail
- 20 Greenway Dr
- 50 Trinity Ln
- 130 Hazelhurst Dr
- 345 Timberlake Terrace
- 380 Spring Lake Terrace
- 160 Charleston Place
- 150 Charleston Place
- 115 Jericho Dr
- 65 Jericho Dr
- 145 Glynnshire Ct
- 417 Rosser Rd
- 50 Freedom Ct
- 45 Salem Ridge
- 7 Glynnshire Ct
- 195 Dairyland Dr Unit 697
- 195 Dairyland Dr
- 215 Dairyland Dr
- 180 Greenway Dr
- 170 Greenway Dr
- 225 Dairyland Dr
- 225 Dairyland Dr Unit 694
- 185 Dairyland Dr
- 190 Greenway Dr
- 220 Dairyland Dr
- 210 Dairyland Dr
- 160 Greenway Dr Unit 160
- 160 Greenway Dr
- 160 Greenway Dr Unit 1
- 230 Dairyland Dr
- 235 Dairyland Dr
- 175 Dairyland Dr
- 240 Dairyland Dr
- 200 Dairyland Dr
- 200 Greenway Dr