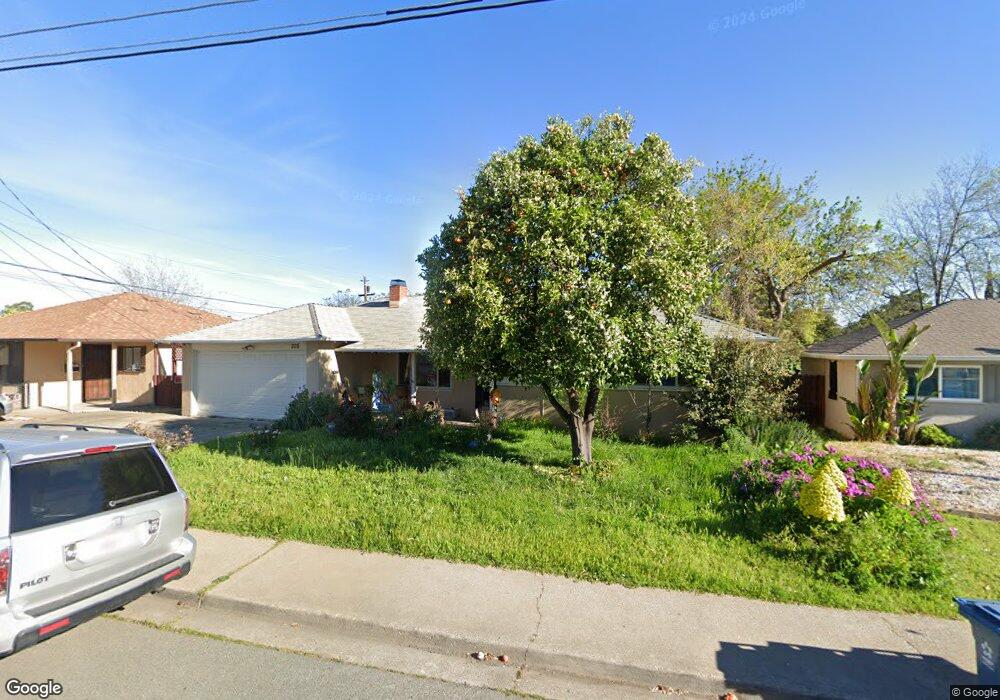
205 E 13th St Antioch, CA 94509
North Antioch NeighborhoodEstimated Value: $424,000 - $477,000
3
Beds
1
Bath
1,021
Sq Ft
$442/Sq Ft
Est. Value
About This Home
This home is located at 205 E 13th St, Antioch, CA 94509 and is currently estimated at $451,791, approximately $442 per square foot. 205 E 13th St is a home located in Contra Costa County with nearby schools including Kimball Elementary School, Antioch Middle School, and Antioch High School.
Ownership History
Date
Name
Owned For
Owner Type
Purchase Details
Closed on
Sep 13, 2024
Sold by
Rivera Reyna E
Bought by
Reyna E Rivera Trust and Rivera
Current Estimated Value
Purchase Details
Closed on
Oct 12, 2011
Sold by
Secretary Of Housing & Urban Development
Bought by
Rivera Reyna E
Home Financials for this Owner
Home Financials are based on the most recent Mortgage that was taken out on this home.
Original Mortgage
$116,531
Interest Rate
4.05%
Mortgage Type
FHA
Purchase Details
Closed on
May 7, 2011
Sold by
Keith Jennifer E
Bought by
The Secretary Of Housing & Urban Develop
Purchase Details
Closed on
Mar 21, 2007
Sold by
Neasham Doyle J
Bought by
Living Trust Of Doyle J Neasham & Irene
Purchase Details
Closed on
Jul 18, 2000
Sold by
Neasham Doyle J and Neasham Irene B
Bought by
Neasham Doyle J and Neasham Irene B
Create a Home Valuation Report for This Property
The Home Valuation Report is an in-depth analysis detailing your home's value as well as a comparison with similar homes in the area
Home Values in the Area
Average Home Value in this Area
Purchase History
| Date | Buyer | Sale Price | Title Company |
|---|---|---|---|
| Reyna E Rivera Trust | -- | None Listed On Document | |
| Rivera Reyna E | $119,000 | Chicago Title Company | |
| The Secretary Of Housing & Urban Develop | $287,867 | None Available | |
| Living Trust Of Doyle J Neasham & Irene | -- | None Available | |
| Neasham Doyle J | -- | -- |
Source: Public Records
Mortgage History
| Date | Status | Borrower | Loan Amount |
|---|---|---|---|
| Previous Owner | Rivera Reyna E | $116,531 |
Source: Public Records
Tax History
| Year | Tax Paid | Tax Assessment Tax Assessment Total Assessment is a certain percentage of the fair market value that is determined by local assessors to be the total taxable value of land and additions on the property. | Land | Improvement |
|---|---|---|---|---|
| 2025 | $7,971 | $149,460 | $79,125 | $70,335 |
| 2024 | $7,837 | $146,530 | $77,574 | $68,956 |
| 2023 | $7,837 | $143,657 | $76,053 | $67,604 |
| 2022 | $3,624 | $140,841 | $74,562 | $66,279 |
| 2021 | $3,544 | $138,080 | $73,100 | $64,980 |
| 2019 | $3,487 | $133,986 | $70,933 | $63,053 |
| 2018 | $3,419 | $131,360 | $69,543 | $61,817 |
| 2017 | $3,366 | $128,785 | $68,180 | $60,605 |
| 2016 | $3,311 | $126,261 | $66,844 | $59,417 |
| 2015 | $1,681 | $124,365 | $65,840 | $58,525 |
| 2014 | $1,626 | $121,930 | $64,551 | $57,379 |
Source: Public Records
Map
Nearby Homes
Your Personal Tour Guide
Ask me questions while you tour the home.