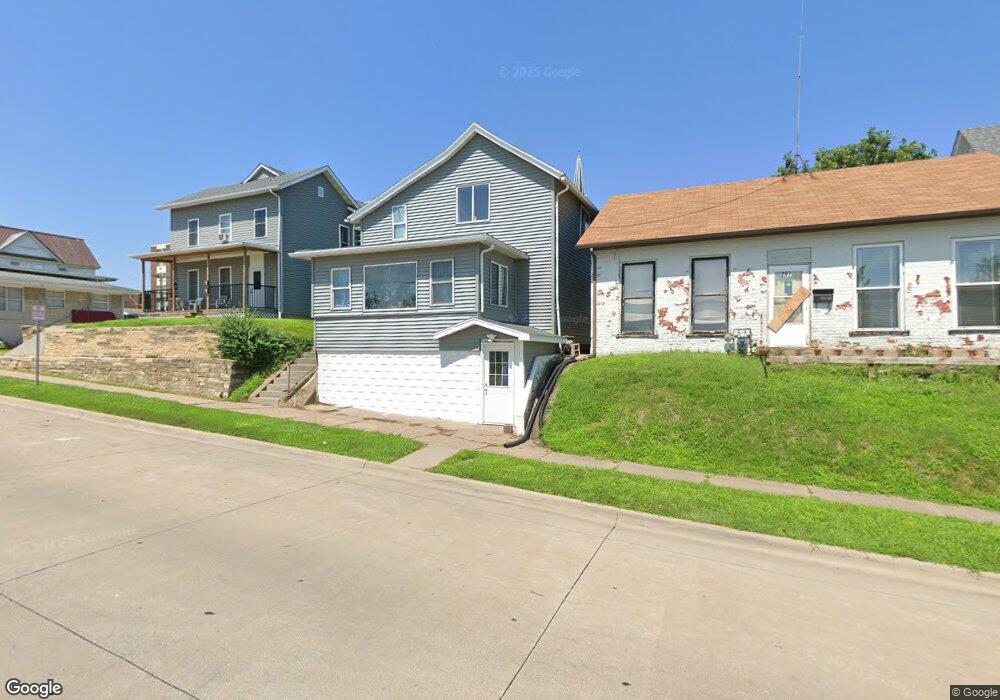
205 E 5th St Muscatine, IA 52761
Estimated Value: $94,000 - $151,833
4
Beds
3
Baths
1,290
Sq Ft
$96/Sq Ft
Est. Value
About This Home
This home is located at 205 E 5th St, Muscatine, IA 52761 and is currently estimated at $123,458, approximately $95 per square foot. 205 E 5th St is a home located in Muscatine County with nearby schools including Jefferson Elementary School, Central Middle School, and Muscatine High School.
Ownership History
Date
Name
Owned For
Owner Type
Purchase Details
Closed on
May 31, 2022
Sold by
Ganzer Dan L and Ganzer Lisa F
Bought by
Muscatine Housing Solutions Llc
Current Estimated Value
Purchase Details
Closed on
Nov 13, 2018
Sold by
King Grace E
Bought by
Ganzer Dan L and Ganzer Lisa F
Home Financials for this Owner
Home Financials are based on the most recent Mortgage that was taken out on this home.
Original Mortgage
$53,500
Interest Rate
4.7%
Mortgage Type
Future Advance Clause Open End Mortgage
Create a Home Valuation Report for This Property
The Home Valuation Report is an in-depth analysis detailing your home's value as well as a comparison with similar homes in the area
Home Values in the Area
Average Home Value in this Area
Purchase History
| Date | Buyer | Sale Price | Title Company |
|---|---|---|---|
| Muscatine Housing Solutions Llc | $125,000 | Stanley Lande & Hunter Pc | |
| Ganzer Dan L | $47,500 | None Available |
Source: Public Records
Mortgage History
| Date | Status | Borrower | Loan Amount |
|---|---|---|---|
| Previous Owner | Ganzer Dan L | $53,500 |
Source: Public Records
Tax History Compared to Growth
Tax History
| Year | Tax Paid | Tax Assessment Tax Assessment Total Assessment is a certain percentage of the fair market value that is determined by local assessors to be the total taxable value of land and additions on the property. | Land | Improvement |
|---|---|---|---|---|
| 2025 | -- | $116,620 | $8,760 | $107,860 |
| 2024 | -- | $116,330 | $0 | $0 |
| 2023 | $1,644 | $110,520 | $0 | $0 |
| 2022 | $1,336 | $81,700 | $8,250 | $73,450 |
| 2021 | $1,336 | $65,520 | $8,250 | $57,270 |
| 2020 | $1,474 | $70,100 | $8,250 | $61,850 |
| 2019 | $1,472 | $66,670 | $0 | $0 |
| 2018 | $1,446 | $66,330 | $0 | $0 |
| 2017 | $1,446 | $78,570 | $0 | $0 |
| 2016 | $1,776 | $78,570 | $0 | $0 |
| 2015 | $1,776 | $71,100 | $0 | $0 |
| 2014 | $1,618 | $71,100 | $0 | $0 |
Source: Public Records
Map
Nearby Homes