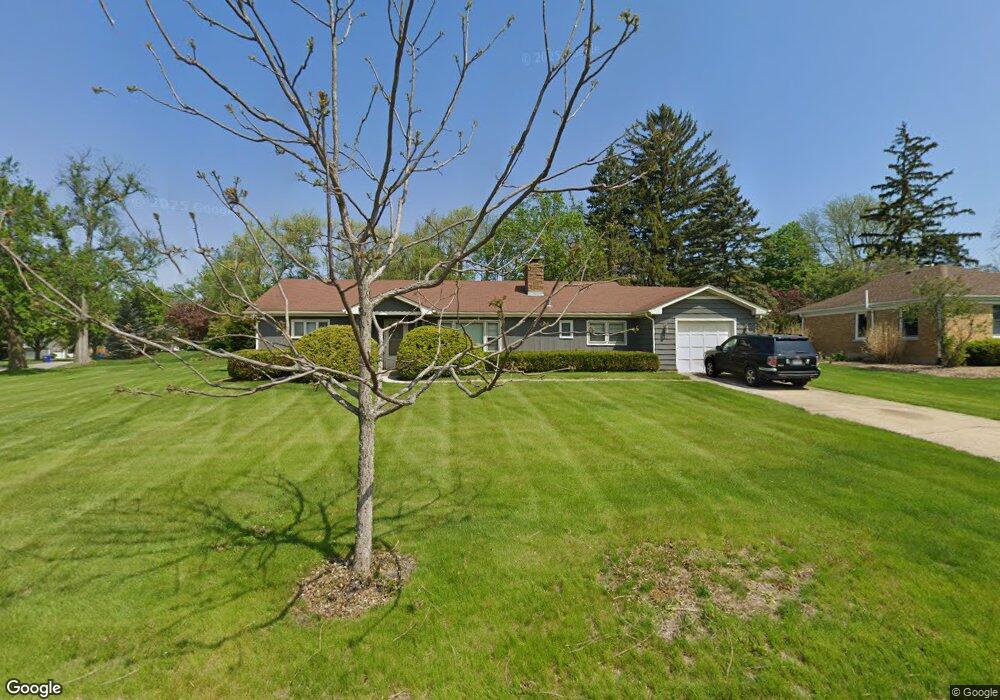
205 E Elm St Unit 1 Wheaton, IL 60189
Southeast Wheaton NeighborhoodEstimated Value: $434,788 - $521,000
3
Beds
2
Baths
1,609
Sq Ft
$296/Sq Ft
Est. Value
About This Home
This home is located at 205 E Elm St Unit 1, Wheaton, IL 60189 and is currently estimated at $476,697, approximately $296 per square foot. 205 E Elm St Unit 1 is a home located in DuPage County with nearby schools including Whittier Elementary School, Edison Middle School, and Wheaton Warrenville South High School.
Ownership History
Date
Name
Owned For
Owner Type
Purchase Details
Closed on
Apr 12, 2014
Sold by
May Mary F
Bought by
May Frank B and May Mary F
Current Estimated Value
Purchase Details
Closed on
Nov 5, 2012
Sold by
May Frank B and May Mary F
Bought by
May Mary F
Purchase Details
Closed on
Aug 19, 2009
Sold by
Chicago Title Land Trust Company
Bought by
May Frank B and May Mary F
Home Financials for this Owner
Home Financials are based on the most recent Mortgage that was taken out on this home.
Original Mortgage
$222,000
Interest Rate
3.73%
Mortgage Type
New Conventional
Purchase Details
Closed on
Apr 8, 1997
Sold by
Blodgett Brad and Blodgett Darrell R
Bought by
American National Bk & Tr Co Of Chicago and Trust #7488
Create a Home Valuation Report for This Property
The Home Valuation Report is an in-depth analysis detailing your home's value as well as a comparison with similar homes in the area
Home Values in the Area
Average Home Value in this Area
Purchase History
| Date | Buyer | Sale Price | Title Company |
|---|---|---|---|
| May Frank B | -- | None Available | |
| May Mary F | -- | Chicago Title Insurance Comp | |
| May Frank B | -- | Chicago Title Land Trust Co | |
| American National Bk & Tr Co Of Chicago | $160,000 | -- |
Source: Public Records
Mortgage History
| Date | Status | Borrower | Loan Amount |
|---|---|---|---|
| Previous Owner | May Frank B | $222,000 |
Source: Public Records
Tax History
| Year | Tax Paid | Tax Assessment Tax Assessment Total Assessment is a certain percentage of the fair market value that is determined by local assessors to be the total taxable value of land and additions on the property. | Land | Improvement |
|---|---|---|---|---|
| 2024 | $8,508 | $140,004 | $46,237 | $93,767 |
| 2023 | $8,168 | $128,870 | $42,560 | $86,310 |
| 2022 | $8,019 | $121,790 | $40,220 | $81,570 |
| 2021 | $7,991 | $118,900 | $39,270 | $79,630 |
| 2020 | $7,965 | $117,790 | $38,900 | $78,890 |
| 2019 | $7,781 | $114,680 | $37,870 | $76,810 |
| 2018 | $7,376 | $107,840 | $35,680 | $72,160 |
| 2017 | $7,263 | $103,860 | $34,360 | $69,500 |
| 2016 | $7,163 | $99,710 | $32,990 | $66,720 |
| 2015 | $7,103 | $95,120 | $31,470 | $63,650 |
| 2014 | $8,061 | $99,420 | $38,860 | $60,560 |
| 2013 | $7,380 | $99,720 | $38,980 | $60,740 |
Source: Public Records
Map
Nearby Homes
- 715 S Naperville Rd
- 1315 Underwood Terrace
- 522 S West St
- 421 E Willow Ave
- 536 W Evergreen St
- 1219 Golf Ln
- 840 Sheldon Ct Unit B
- 353 E Liberty Dr
- 1019 Pershing Ave
- 510 S President St
- 1021 Greenwood Dr
- 570 Riva Ct
- 1026 Briarcliffe Blvd
- 1216 E Elm St
- 405 W Front St Unit 3207
- 1028 Lodalia Ct
- 1129 Rhodes Ct
- 833 Parkside Dr
- 502 S Summit St
- 312 E Lincoln Ave
Your Personal Tour Guide
Ask me questions while you tour the home.