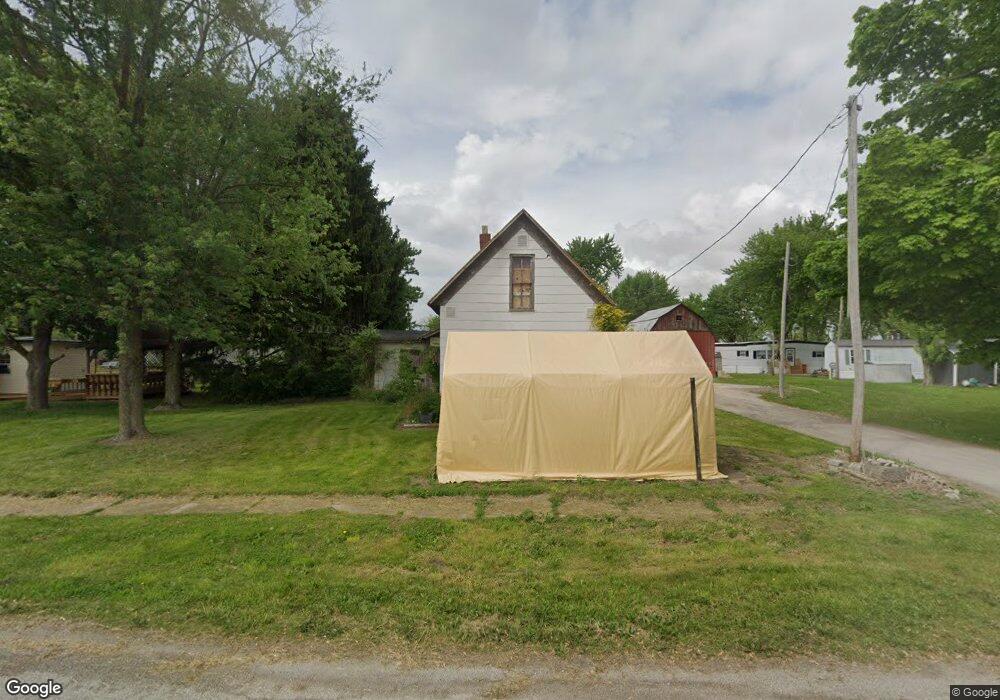
205 E First St Converse, IN 46919
Estimated Value: $49,000 - $134,000
3
Beds
1
Bath
1,676
Sq Ft
$55/Sq Ft
Est. Value
About This Home
This home is located at 205 E First St, Converse, IN 46919 and is currently estimated at $91,620, approximately $54 per square foot. 205 E First St is a home located in Miami County with nearby schools including Converse Elementary School, Sweetser Elementary School, and Oak Hill Junior High School.
Ownership History
Date
Name
Owned For
Owner Type
Purchase Details
Closed on
Feb 7, 2025
Sold by
Walker Robert G and Walker Susan E
Bought by
Sulfridge Dustin P and Sulfridge Beverly D
Current Estimated Value
Purchase Details
Closed on
Jun 2, 2005
Sold by
Dedman John L and Dedman John
Bought by
Walker Robert G and Walker Susan E
Home Financials for this Owner
Home Financials are based on the most recent Mortgage that was taken out on this home.
Original Mortgage
$22,000
Interest Rate
5.82%
Mortgage Type
New Conventional
Create a Home Valuation Report for This Property
The Home Valuation Report is an in-depth analysis detailing your home's value as well as a comparison with similar homes in the area
Purchase History
| Date | Buyer | Sale Price | Title Company |
|---|---|---|---|
| Sulfridge Dustin P | -- | First American Title | |
| Walker Robert G | -- | None Available |
Source: Public Records
Mortgage History
| Date | Status | Borrower | Loan Amount |
|---|---|---|---|
| Previous Owner | Walker Robert G | $22,000 |
Source: Public Records
Tax History
| Year | Tax Paid | Tax Assessment Tax Assessment Total Assessment is a certain percentage of the fair market value that is determined by local assessors to be the total taxable value of land and additions on the property. | Land | Improvement |
|---|---|---|---|---|
| 2025 | $648 | $39,600 | $5,900 | $33,700 |
| 2024 | $648 | $30,600 | $5,900 | $24,700 |
| 2023 | $617 | $30,900 | $5,900 | $25,000 |
| 2022 | $633 | $30,900 | $5,900 | $25,000 |
| 2021 | $587 | $28,700 | $5,900 | $22,800 |
| 2020 | $587 | $28,700 | $5,900 | $22,800 |
| 2019 | $592 | $28,700 | $5,900 | $22,800 |
| 2018 | $587 | $28,700 | $5,900 | $22,800 |
| 2017 | $541 | $26,500 | $5,900 | $20,600 |
| 2016 | $541 | $26,500 | $5,900 | $20,600 |
| 2014 | $535 | $26,200 | $5,900 | $20,300 |
| 2013 | -- | $32,600 | $5,900 | $26,700 |
Source: Public Records
Map
Nearby Homes
- 201 E First St
- 218 E 1st St
- 204 E Second St
- 208 E First St
- 202 E Second St
- 204 W Railroad St
- 315 N Hickory St
- 108 E Second St
- 106 E Second St
- 122 N Madison St
- 205 E Second St
- 109 E Second St
- 119 N Washington St
- 120 N Madison St
- 408 N Jefferson St
- 101 E Second St
- 119 N Madison St
- 118 N Madison St
- 115 N Washington St
Your Personal Tour Guide
Ask me questions while you tour the home.