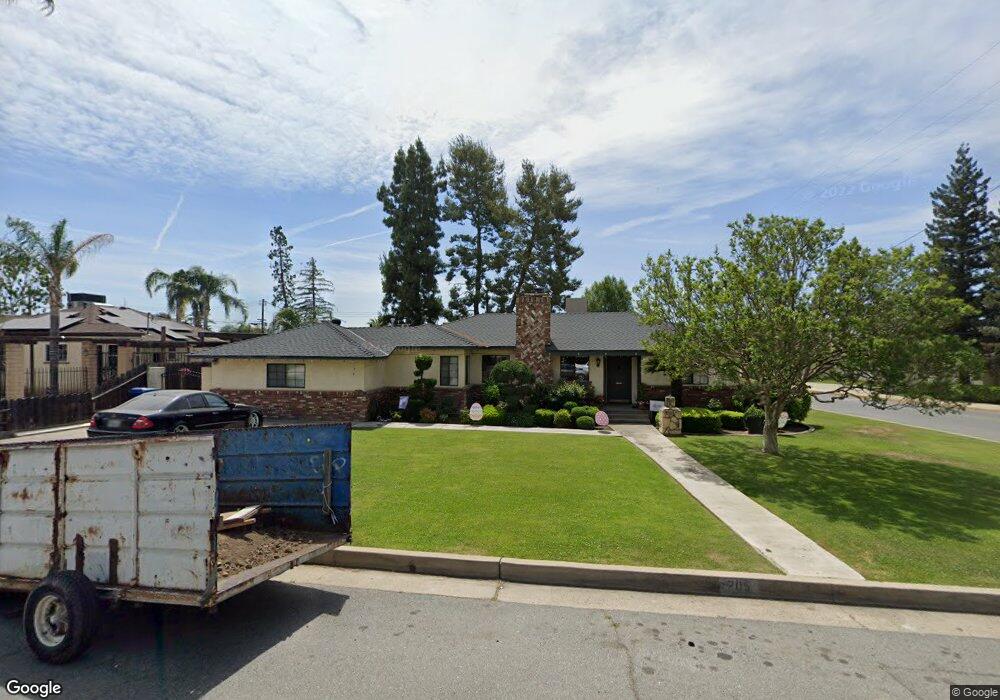
205 La Colina Dr Bakersfield, CA 93305
College Heights NeighborhoodEstimated Value: $352,000 - $471,000
4
Beds
2
Baths
1,530
Sq Ft
$273/Sq Ft
Est. Value
About This Home
This home is located at 205 La Colina Dr, Bakersfield, CA 93305 and is currently estimated at $418,341, approximately $273 per square foot. 205 La Colina Dr is a home located in Kern County with nearby schools including Myra A. Noble Elementary School, Washington Middle School, and East Bakersfield High School.
Ownership History
Date
Name
Owned For
Owner Type
Purchase Details
Closed on
Aug 24, 2016
Sold by
Gonzales Carla A
Bought by
Gonzales Chris D and Gonzales Carla A
Current Estimated Value
Home Financials for this Owner
Home Financials are based on the most recent Mortgage that was taken out on this home.
Original Mortgage
$154,500
Outstanding Balance
$70,598
Interest Rate
3.45%
Mortgage Type
New Conventional
Estimated Equity
$347,743
Purchase Details
Closed on
Sep 10, 1997
Sold by
Neira Samuel D
Bought by
Gonzales Carla A
Purchase Details
Closed on
Mar 14, 1996
Sold by
Neira Gloria
Bought by
Neira Samuel D
Home Financials for this Owner
Home Financials are based on the most recent Mortgage that was taken out on this home.
Original Mortgage
$133,180
Interest Rate
6.98%
Mortgage Type
FHA
Purchase Details
Closed on
Mar 2, 1995
Sold by
California Capital Fund Inc
Bought by
California Capital Fund Inc
Create a Home Valuation Report for This Property
The Home Valuation Report is an in-depth analysis detailing your home's value as well as a comparison with similar homes in the area
Home Values in the Area
Average Home Value in this Area
Purchase History
We collect this data history from publicly available records. To have your information removed, we recommend requesting removal directly through your county’s website.
| Date | Buyer | Sale Price | Title Company |
|---|---|---|---|
| Gonzales Chris D | -- | Placer Title Company | |
| Gonzales Carla A | -- | First American Title Ins Co | |
| Neira Samuel D | -- | Chicago Title Co | |
| Neira Samuel D | $135,000 | Chicago Title Co | |
| California Capital Fund Inc | $22,753 | -- |
Source: Public Records
Mortgage History
We collect this data history from publicly available records. To have your information removed, we recommend requesting removal directly through your county’s website.
| Date | Status | Borrower | Loan Amount |
|---|---|---|---|
| Open | Gonzales Chris D | $154,500 | |
| Previous Owner | Neira Samuel D | $133,180 |
Source: Public Records
Tax History
| Year | Tax Paid | Tax Assessment Tax Assessment Total Assessment is a certain percentage of the fair market value that is determined by local assessors to be the total taxable value of land and additions on the property. | Land | Improvement |
|---|---|---|---|---|
| 2025 | $3,389 | $215,534 | $39,905 | $175,629 |
| 2024 | $3,302 | $211,309 | $39,123 | $172,186 |
| 2023 | $3,302 | $207,166 | $38,356 | $168,810 |
| 2022 | $3,195 | $203,104 | $37,604 | $165,500 |
| 2021 | $3,083 | $199,122 | $36,867 | $162,255 |
| 2020 | $3,043 | $197,081 | $36,489 | $160,592 |
| 2019 | $2,958 | $197,081 | $36,489 | $160,592 |
| 2018 | $2,880 | $189,430 | $35,073 | $154,357 |
| 2017 | $2,856 | $185,717 | $34,386 | $151,331 |
| 2016 | $2,520 | $182,076 | $33,712 | $148,364 |
| 2015 | $2,516 | $179,342 | $33,206 | $146,136 |
| 2014 | $2,441 | $175,830 | $32,556 | $143,274 |
Source: Public Records
Map
Nearby Homes
- 220 Jeffrey St
- 172 La Mesa Dr
- 2820 Alta Vista Dr
- 2804 Elmwood Ave
- 319 Poplar Ave
- 317 Columbus St
- 2415 Alta Vista Dr
- 2701 N Inyo St
- 2418 N Inyo St
- 129 La Mesa Dr
- 326 Jeffrey St
- 2880 N Inyo St
- 2800 Skyline Blvd
- 4208 Tierra Verde St Unit 17
- 251 Irene St
- 2125 Sacramento St
- 616 Magnolia Ave
- 4412 Isla Verde St
- 4317 Isla Verde St
- 505 Jeffrey St
- 2718 La Cresta Dr
- 2714 La Cresta Dr
- 2722 La Cresta Dr
- 2724 La Cresta Dr
- 2710 La Cresta Dr
- 2717 Loma Linda Dr
- 2721 Loma Linda Dr
- 2713 Loma Linda Dr
- 2725 Loma Linda Dr
- 2728 La Cresta Dr
- 211 La Colina Dr
- 2704 La Cresta Dr
- 2709 Loma Linda Dr
- 2721 La Cresta Dr
- 207 La Colina Dr
- 2715 La Cresta Dr
- 2709 La Cresta Dr
- 215 La Colina Dr
- 2727 La Cresta Dr
- 2705 Loma Linda Dr
Your Personal Tour Guide
Ask me questions while you tour the home.