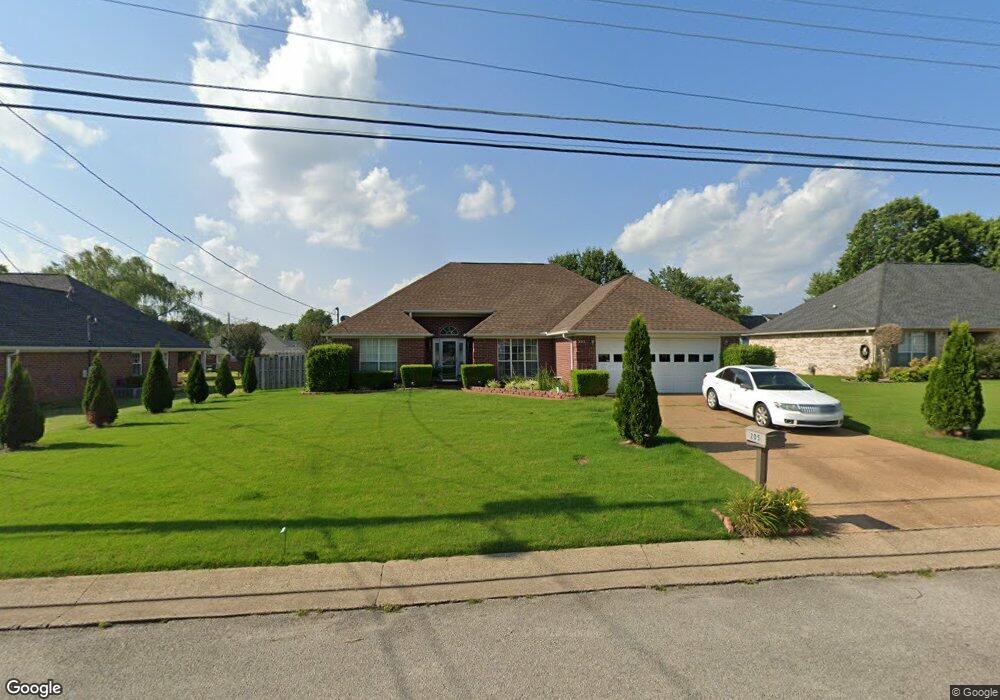
205 Maddox Dr Jackson, TN 38305
Estimated Value: $219,066 - $265,000
3
Beds
2
Baths
1,560
Sq Ft
$157/Sq Ft
Est. Value
About This Home
This home is located at 205 Maddox Dr, Jackson, TN 38305 and is currently estimated at $245,017, approximately $157 per square foot. 205 Maddox Dr is a home located in Madison County with nearby schools including Thelma Barker Elementary School, Northeast Middle School, and North Side High School.
Ownership History
Date
Name
Owned For
Owner Type
Purchase Details
Closed on
Apr 22, 2015
Sold by
Villegas Jose M
Bought by
Villegas Karina M
Current Estimated Value
Home Financials for this Owner
Home Financials are based on the most recent Mortgage that was taken out on this home.
Original Mortgage
$72,064
Outstanding Balance
$55,257
Interest Rate
3.79%
Mortgage Type
New Conventional
Estimated Equity
$189,760
Purchase Details
Closed on
Mar 16, 2012
Sold by
Franks Chanda
Bought by
Villegas Jose M and Villegas Karina M
Home Financials for this Owner
Home Financials are based on the most recent Mortgage that was taken out on this home.
Original Mortgage
$89,675
Interest Rate
3.89%
Mortgage Type
Commercial
Purchase Details
Closed on
Feb 27, 2001
Sold by
Baker Drew W
Bought by
Chanda Franks
Purchase Details
Closed on
Feb 23, 2001
Bought by
Franks Chanda
Purchase Details
Closed on
Mar 3, 1998
Bought by
Baker Drew W
Purchase Details
Closed on
Oct 17, 1996
Bought by
Matlock Family Lp
Create a Home Valuation Report for This Property
The Home Valuation Report is an in-depth analysis detailing your home's value as well as a comparison with similar homes in the area
Purchase History
| Date | Buyer | Sale Price | Title Company |
|---|---|---|---|
| Villegas Karina M | -- | -- | |
| Villegas Jose M | $105,500 | -- | |
| Chanda Franks | $110,650 | -- | |
| Franks Chanda | $110,700 | -- | |
| Baker Drew W | $106,100 | -- | |
| Matlock Family Lp | $242,000 | -- |
Source: Public Records
Mortgage History
| Date | Status | Borrower | Loan Amount |
|---|---|---|---|
| Open | Villegas Karina M | $72,064 | |
| Previous Owner | Villegas Jose M | $89,675 |
Source: Public Records
Tax History
| Year | Tax Paid | Tax Assessment Tax Assessment Total Assessment is a certain percentage of the fair market value that is determined by local assessors to be the total taxable value of land and additions on the property. | Land | Improvement |
|---|---|---|---|---|
| 2025 | $855 | $45,650 | $6,250 | $39,400 |
| 2024 | $855 | $45,650 | $6,250 | $39,400 |
| 2022 | $1,591 | $45,650 | $6,250 | $39,400 |
| 2021 | $1,230 | $28,525 | $4,250 | $24,275 |
| 2020 | $1,230 | $28,525 | $4,250 | $24,275 |
| 2019 | $1,230 | $28,525 | $4,250 | $24,275 |
| 2018 | $1,230 | $28,525 | $4,250 | $24,275 |
| 2017 | $1,217 | $27,575 | $4,250 | $23,325 |
| 2016 | $1,134 | $27,575 | $4,250 | $23,325 |
| 2015 | $1,134 | $27,575 | $4,250 | $23,325 |
| 2014 | -- | $27,750 | $4,250 | $23,500 |
Source: Public Records
Map
Nearby Homes
- 26 Winston Place
- 110 Union Fort Dr
- 1680 Ashport Rd
- 31 Bellwood Cove
- 127 Parker Dr
- 00 Ashport Rd
- 38 Hearthstone Cove
- 8 Lake Breeze Dr
- 67 Woodshire Cove
- 18 Admirals Pointe
- 77 Grande Pines Cove
- 74 Volunteer Blvd
- 0 Ameristeel Rd
- 36 Grande Pines Cove
- 11 Grande Pines Cove
- 7 Scenic Lake Cove
- 98 Volunteer Blvd
- 151 Netherwood Dr
- 110 Volunteer Blvd
- 12 Doe Valley Cove
- 197 Maddox Dr
- 34 N Gettysburg Dr
- 28 N Gettysburg Dr
- 221 Maddox Dr
- 189 Maddox Dr
- 40 N Gettysburg Dr
- 22 N Gettysburg Dr
- 9 Battlefield Cove
- 8 Battlefield Cove
- 46 N Gettysburg Dr
- 16 N Gettysburg Dr
- 229 Maddox Dr
- 181 Maddox Dr
- 17 Battlefield Cove
- 16 Battlefield Cove
- 52 N Gettysburg Dr
- 226 Maddox Dr
- 10 N Gettysburg Dr
- 11 Pickens Cove
- 8 Battery Cove
Your Personal Tour Guide
Ask me questions while you tour the home.