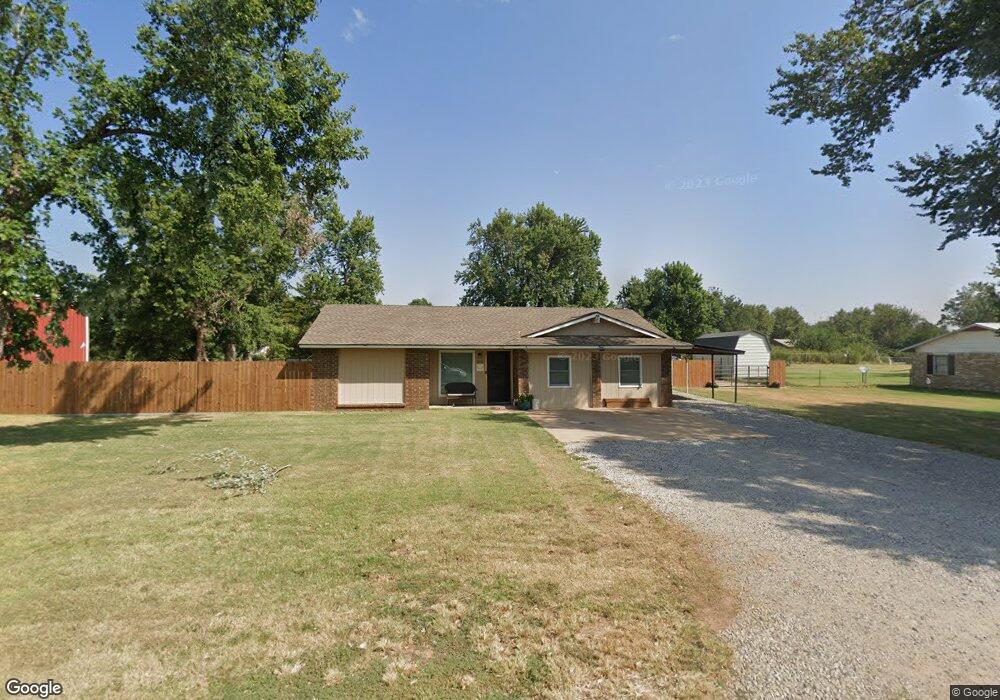
205 Maple St Hennessey, OK 73742
Estimated Value: $134,000 - $149,943
3
Beds
2
Baths
1,442
Sq Ft
$98/Sq Ft
Est. Value
About This Home
This home is located at 205 Maple St, Hennessey, OK 73742 and is currently estimated at $141,236, approximately $97 per square foot. 205 Maple St is a home located in Kingfisher County with nearby schools including Hennessey Lower Elementary School, Hennessey Upper Elementary School, and Hennessey High School.
Ownership History
Date
Name
Owned For
Owner Type
Purchase Details
Closed on
Apr 20, 2023
Sold by
Gonzales Santiago and Gonzales Martha
Bought by
Gonzales Evelin and Escobedo Marcelina
Current Estimated Value
Purchase Details
Closed on
Sep 30, 2020
Sold by
Valenzuela Ortega M and Valenzuela Lorena
Bought by
Olmos Sugey P and Olmos Cesar R
Home Financials for this Owner
Home Financials are based on the most recent Mortgage that was taken out on this home.
Original Mortgage
$78,551
Interest Rate
2.9%
Mortgage Type
FHA
Purchase Details
Closed on
Jul 9, 2015
Sold by
Parnell Charelene
Bought by
Ortega M Abraham and Valenzuela Lorena
Purchase Details
Closed on
Aug 16, 1999
Sold by
Teresa Usa and Teresa Stallings
Bought by
Thomas Parnell
Purchase Details
Closed on
Feb 27, 1995
Sold by
William B Cooper
Bought by
Teresa Stallings
Purchase Details
Closed on
Mar 24, 1994
Sold by
Charles E Patocka
Bought by
William B Cooper
Create a Home Valuation Report for This Property
The Home Valuation Report is an in-depth analysis detailing your home's value as well as a comparison with similar homes in the area
Home Values in the Area
Average Home Value in this Area
Purchase History
| Date | Buyer | Sale Price | Title Company |
|---|---|---|---|
| Gonzales Evelin | $5,000 | None Listed On Document | |
| Olmos Sugey P | $80,000 | Chicago Title Oklahoma Co | |
| Ortega M Abraham | $43,000 | None Available | |
| Thomas Parnell | $24,700 | -- | |
| Teresa Stallings | $53,000 | -- | |
| William B Cooper | $37,500 | -- |
Source: Public Records
Mortgage History
| Date | Status | Borrower | Loan Amount |
|---|---|---|---|
| Previous Owner | Olmos Sugey P | $78,551 |
Source: Public Records
Tax History Compared to Growth
Tax History
| Year | Tax Paid | Tax Assessment Tax Assessment Total Assessment is a certain percentage of the fair market value that is determined by local assessors to be the total taxable value of land and additions on the property. | Land | Improvement |
|---|---|---|---|---|
| 2025 | $661 | $9,616 | $1,100 | $8,516 |
| 2024 | $661 | $9,336 | $1,100 | $8,236 |
| 2023 | $640 | $9,336 | $1,100 | $8,236 |
| 2022 | $618 | $8,800 | $1,100 | $7,700 |
| 2021 | $603 | $8,800 | $1,100 | $7,700 |
| 2020 | $591 | $7,597 | $1,100 | $6,497 |
| 2019 | $547 | $7,484 | $1,060 | $6,424 |
| 2018 | $492 | $7,127 | $991 | $6,136 |
| 2017 | $513 | $6,789 | $925 | $5,864 |
| 2016 | $484 | $6,465 | $872 | $5,593 |
| 2015 | $465 | $6,158 | $359 | $5,799 |
| 2014 | $457 | $5,864 | $517 | $5,347 |
Source: Public Records
Map
Nearby Homes
- 202 Maple St
- 222 S Main St
- 114 S Main St
- 414 E Oklahoma St
- 434 N Oak Ave
- 520 N Meramac Dr
- 617 E Cleveland Dr
- 400 E Jack Choate Ave
- 0 Oklahoma 51
- 0 N2900 Rd
- 4250 N 2823 Rd
- 13281 N 2870 Rd
- 113 W Chestnut St
- 6350 W Hyw 51 Hwy
- 12931 N2910 Rd
- W Sumner Rd Lots 1-5
- W Sumner Rd Unit 6
- 0 W Sumner Rd Unit 4
- 0 W Sumner Rd Unit 5
- 0 W Sumner Rd Unit 3