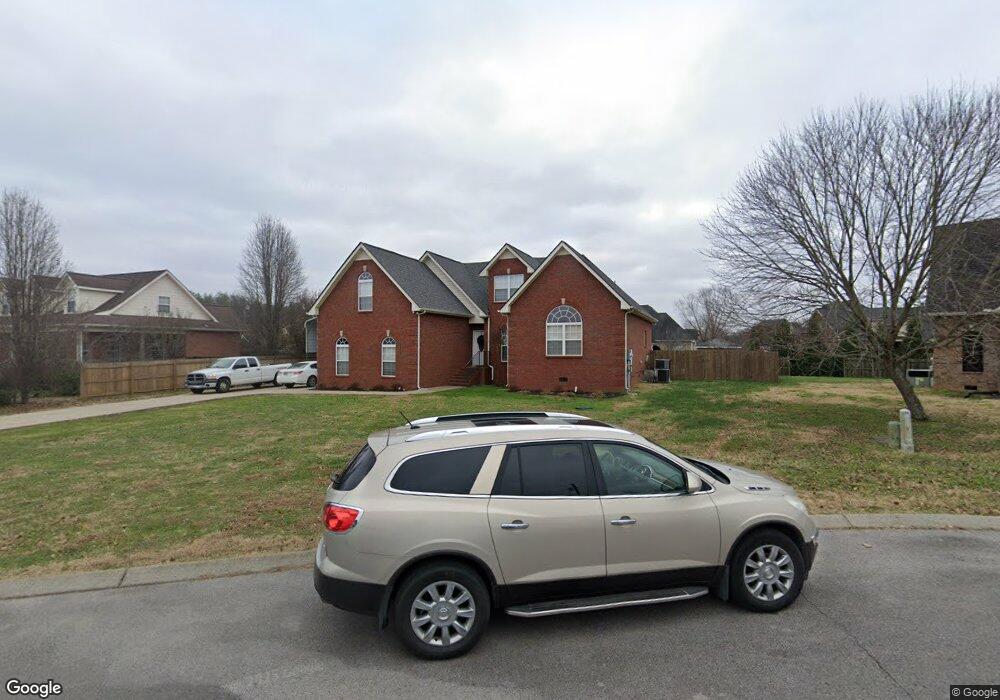
205 Merrywood Ct Murfreesboro, TN 37129
Estimated Value: $509,368 - $597,000
--
Bed
--
Bath
2,551
Sq Ft
$213/Sq Ft
Est. Value
About This Home
This home is located at 205 Merrywood Ct, Murfreesboro, TN 37129 and is currently estimated at $544,342, approximately $213 per square foot. 205 Merrywood Ct is a home located in Rutherford County with nearby schools including Wilson Elementary School, Siegel Middle School, and Siegel High School.
Ownership History
Date
Name
Owned For
Owner Type
Purchase Details
Closed on
Jan 30, 2006
Sold by
Mitchell Bowman J
Bought by
Purvis Robert Y and Purvis Crystal L
Current Estimated Value
Home Financials for this Owner
Home Financials are based on the most recent Mortgage that was taken out on this home.
Original Mortgage
$229,085
Outstanding Balance
$128,507
Interest Rate
6.14%
Estimated Equity
$415,835
Create a Home Valuation Report for This Property
The Home Valuation Report is an in-depth analysis detailing your home's value as well as a comparison with similar homes in the area
Home Values in the Area
Average Home Value in this Area
Purchase History
| Date | Buyer | Sale Price | Title Company |
|---|---|---|---|
| Purvis Robert Y | $230,900 | -- |
Source: Public Records
Mortgage History
| Date | Status | Borrower | Loan Amount |
|---|---|---|---|
| Open | Purvis Robert Y | $229,085 |
Source: Public Records
Tax History Compared to Growth
Tax History
| Year | Tax Paid | Tax Assessment Tax Assessment Total Assessment is a certain percentage of the fair market value that is determined by local assessors to be the total taxable value of land and additions on the property. | Land | Improvement |
|---|---|---|---|---|
| 2025 | $2,206 | $117,600 | $15,000 | $102,600 |
| 2024 | $2,206 | $117,600 | $15,000 | $102,600 |
| 2023 | $2,206 | $117,600 | $15,000 | $102,600 |
| 2022 | $1,835 | $113,550 | $15,000 | $98,550 |
| 2021 | $1,549 | $69,800 | $11,250 | $58,550 |
| 2020 | $1,549 | $69,800 | $11,250 | $58,550 |
| 2019 | $1,549 | $69,800 | $11,250 | $58,550 |
| 2018 | $1,506 | $71,750 | $0 | $0 |
| 2017 | $1,589 | $59,300 | $0 | $0 |
| 2016 | $1,589 | $59,300 | $0 | $0 |
| 2015 | $1,589 | $59,300 | $0 | $0 |
| 2014 | $1,475 | $59,300 | $0 | $0 |
| 2013 | -- | $59,925 | $0 | $0 |
Source: Public Records
Map
Nearby Homes
- 7408 Cloverdale Way
- 1429 Clemente Way
- 114 Falling Branch Ct
- 102 Winter Wood Dr S
- 3103 Dunmire Dr
- 111 Cannock Ct
- 525 Amberly St
- 205 Apricot Ln
- 502 Beverly Randolph Dr
- 9914 Debra Dr
- 195 Beverly Randolph Dr
- 7956 Lebanon Rd
- 8988 Big Oak Dr
- 1291 Tiger Woods Way
- 3714 W Jefferson Pike
- 4011 Central Valley Rd
- 2430 J D Todd Rd
- 4288 Central Valley Rd
- 308 Amazonway Ridge
- 3491 Allen Barrett Rd
- 201 Merrywood Ct
- 209 Merrywood Ct
- 7109 Harmony Ct
- 7105 Harmony Ct
- 7127 Harmony Ct
- 204 Merrywood Ct
- 213 Merrywood Ct
- 7205 Cloverdale Way
- 208 Merrywood Ct
- 7101 Harmony Ct
- 7136 Cloverdale Way
- 7132 Cloverdale Way
- 7200 Cloverdale Way
- 7120 Harmony Ct
- 7128 Cloverdale Way
- 1108 Golden Creek Ct
- 7204 Cloverdale Way
- 1104 Golden Creek Ct
- 1112 Golden Creek Ct
- 7208 Cloverdale Way