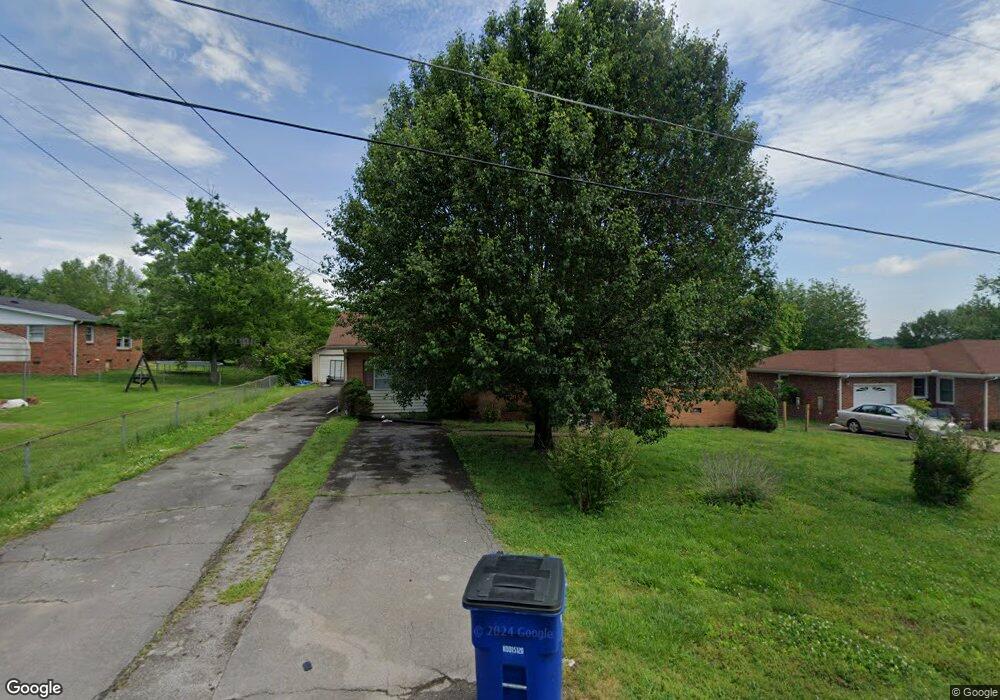
205 Midland St Shelbyville, TN 37160
Estimated Value: $184,565 - $279,000
--
Bed
1
Bath
1,545
Sq Ft
$158/Sq Ft
Est. Value
About This Home
This home is located at 205 Midland St, Shelbyville, TN 37160 and is currently estimated at $243,641, approximately $157 per square foot. 205 Midland St is a home located in Bedford County with nearby schools including South Side Elementary School, Harris Middle School, and Christian Chapel Academy.
Ownership History
Date
Name
Owned For
Owner Type
Purchase Details
Closed on
Jul 29, 2022
Sold by
Clay Jr Vance D and Clay Dianne
Bought by
Pape Carmen and Pape Sarah
Current Estimated Value
Home Financials for this Owner
Home Financials are based on the most recent Mortgage that was taken out on this home.
Original Mortgage
$262,525
Outstanding Balance
$251,190
Interest Rate
5.78%
Mortgage Type
New Conventional
Estimated Equity
-$7,549
Purchase Details
Closed on
Oct 12, 2021
Sold by
Hunley Nancy
Bought by
Clay Vance D and Clay Dianne
Purchase Details
Closed on
Apr 4, 2002
Sold by
Hastings Dianne
Bought by
Hunley Henry C and Hunley Nancy
Purchase Details
Closed on
Aug 14, 1996
Bought by
Hastings Dianne C
Home Financials for this Owner
Home Financials are based on the most recent Mortgage that was taken out on this home.
Original Mortgage
$10,000
Interest Rate
8.2%
Purchase Details
Closed on
Oct 15, 1992
Bought by
Wilhoite Vernon W and Wilhoite Martha V
Purchase Details
Closed on
May 10, 1988
Bought by
Billings Martha U
Purchase Details
Closed on
Dec 29, 1983
Bought by
Coop Keith Jackson
Create a Home Valuation Report for This Property
The Home Valuation Report is an in-depth analysis detailing your home's value as well as a comparison with similar homes in the area
Home Values in the Area
Average Home Value in this Area
Purchase History
| Date | Buyer | Sale Price | Title Company |
|---|---|---|---|
| Pape Carmen | $259,900 | None Listed On Document | |
| Clay Vance D | $155,000 | None Available | |
| Hunley Henry C | $67,000 | -- | |
| Hastings Dianne C | $45,000 | -- | |
| Wilhoite Vernon W | -- | -- | |
| Billings Martha U | $46,900 | -- | |
| Coop Keith Jackson | -- | -- |
Source: Public Records
Mortgage History
| Date | Status | Borrower | Loan Amount |
|---|---|---|---|
| Open | Pape Carmen | $262,525 | |
| Previous Owner | Coop Keith Jackson | $10,000 |
Source: Public Records
Tax History Compared to Growth
Tax History
| Year | Tax Paid | Tax Assessment Tax Assessment Total Assessment is a certain percentage of the fair market value that is determined by local assessors to be the total taxable value of land and additions on the property. | Land | Improvement |
|---|---|---|---|---|
| 2025 | -- | $38,575 | $0 | $0 |
| 2024 | -- | $38,575 | $11,000 | $27,575 |
| 2023 | $1,468 | $38,575 | $11,000 | $27,575 |
| 2022 | $1,510 | $38,575 | $11,000 | $27,575 |
| 2021 | $1,371 | $38,575 | $11,000 | $27,575 |
| 2020 | $998 | $38,575 | $11,000 | $27,575 |
| 2019 | $998 | $22,525 | $3,125 | $19,400 |
| 2018 | $976 | $22,525 | $3,125 | $19,400 |
| 2017 | $976 | $22,525 | $3,125 | $19,400 |
| 2016 | $967 | $22,525 | $3,125 | $19,400 |
| 2015 | $966 | $22,525 | $3,125 | $19,400 |
| 2014 | $856 | $21,824 | $0 | $0 |
Source: Public Records
Map
Nearby Homes
- 207 Midland St
- 905 Cowan Ave
- 903 Cowan Ave
- 305 Charlotte Dr
- 303 Charlotte Dr
- 0 Midland St
- 206 Midland St
- 901 Cowan Ave
- 204 Midland St
- 301 Charlotte Dr
- 208 Midland St
- 211 Midland St
- 210 Midland St
- 1001 Cowan Ave
- 1000 Cowan Ave
- 902 Cowan Ave
- 314 Charlotte Dr
- 203 Charlotte Dr
- 312 Charlotte Dr
- 900 Cowan Ave