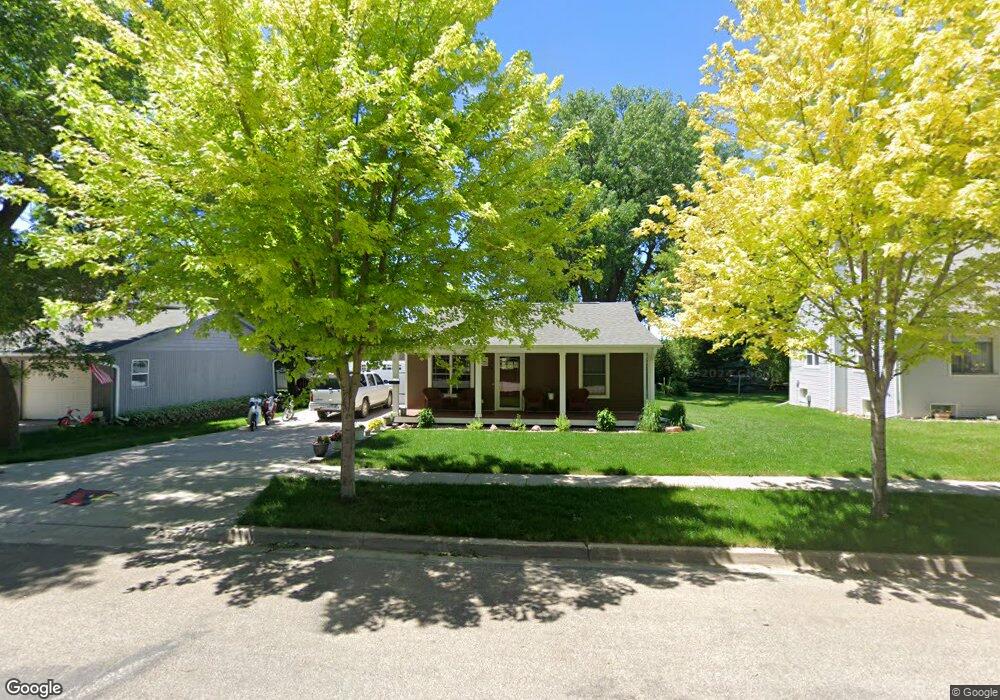
205 N Davidson St Luverne, MN 56156
Estimated Value: $112,000 - $166,000
--
Bed
--
Bath
672
Sq Ft
$212/Sq Ft
Est. Value
About This Home
This home is located at 205 N Davidson St, Luverne, MN 56156 and is currently estimated at $142,796, approximately $212 per square foot. 205 N Davidson St is a home located in Rock County with nearby schools including Luverne Elementary School and Luverne Senior High School.
Ownership History
Date
Name
Owned For
Owner Type
Purchase Details
Closed on
Aug 28, 2015
Sold by
Reverts Dale V and Reverts Cynthia A
Bought by
Connell John Paul
Current Estimated Value
Home Financials for this Owner
Home Financials are based on the most recent Mortgage that was taken out on this home.
Original Mortgage
$30,000
Interest Rate
3.91%
Mortgage Type
New Conventional
Purchase Details
Closed on
Aug 20, 2015
Sold by
Reverts Dale Dale
Bought by
Connell John John
Home Financials for this Owner
Home Financials are based on the most recent Mortgage that was taken out on this home.
Original Mortgage
$30,000
Interest Rate
3.91%
Mortgage Type
New Conventional
Purchase Details
Closed on
Jun 1, 2010
Sold by
Thone Elaine
Bought by
Reverts Dale and Reverts Cynthia A
Purchase Details
Closed on
May 6, 2010
Sold by
Thone Greg A and Thone Judith E
Bought by
Reverts Dale and Reverts Cynthia A
Purchase Details
Closed on
Feb 19, 2007
Sold by
Olson Chad E
Bought by
Reverts Dale V and Reverts Cynthia A
Create a Home Valuation Report for This Property
The Home Valuation Report is an in-depth analysis detailing your home's value as well as a comparison with similar homes in the area
Home Values in the Area
Average Home Value in this Area
Purchase History
| Date | Buyer | Sale Price | Title Company |
|---|---|---|---|
| Connell John Paul | $6,800 | -- | |
| Connell John John | $6,800 | -- | |
| Reverts Dale | $15,000 | None Available | |
| Reverts Dale | $49,500 | None Available | |
| Reverts Dale V | -- | None Available | |
| Reverts Dale V | -- | None Available |
Source: Public Records
Mortgage History
| Date | Status | Borrower | Loan Amount |
|---|---|---|---|
| Previous Owner | Connell John Paul | $30,000 |
Source: Public Records
Tax History Compared to Growth
Tax History
| Year | Tax Paid | Tax Assessment Tax Assessment Total Assessment is a certain percentage of the fair market value that is determined by local assessors to be the total taxable value of land and additions on the property. | Land | Improvement |
|---|---|---|---|---|
| 2025 | $868 | $114,800 | $13,100 | $101,700 |
| 2024 | $868 | $104,400 | $11,000 | $93,400 |
| 2023 | $684 | $90,400 | $11,000 | $79,400 |
| 2022 | $644 | $75,900 | $5,600 | $70,300 |
| 2021 | $570 | $71,400 | $5,600 | $65,800 |
| 2020 | $458 | $63,100 | $5,600 | $57,500 |
| 2019 | $406 | $50,000 | $5,600 | $44,400 |
| 2018 | $382 | $44,300 | $5,600 | $38,700 |
| 2017 | $614 | $40,800 | $5,600 | $35,200 |
| 2016 | $382 | $39,300 | $5,100 | $34,200 |
| 2015 | $370 | $0 | $0 | $0 |
| 2014 | -- | $0 | $0 | $0 |
Source: Public Records
Map
Nearby Homes
- 102 S Walnut Ave
- 511 W Crawford St
- 111 S Donaldson St
- 604 W Warren St
- 717 Tallgrass Cir
- 719 Tallgrass Cir
- 323 W Lincoln St
- 207 N Kniss Ave
- 518 NE Park St
- 320 SW Park St
- 614 N Estey St
- 200 S Freeman Ave Unit 206
- 414 N Freeman Ave
- 109 E Luverne St Unit 337
- 109 E Luverne St Unit 220
- 501 Central Ln
- 613 N Cedar St
- 742 N Freeman Ave
- 201 E Adams Ave
- 201 N Davidson St
- 620 W Lincoln St
- 117 N Davidson St
- 210 N Davidson St
- 611 W Luverne St
- 113 N Davidson St
- 616 W Lincoln St
- 111 N Davidson St
- 609 W Luverne St
- 619 W Lincoln St
- 614 W Lincoln St
- 607 W Luverne St
- 838 W Main St
- 617 W Lincoln St
- 109 N Davidson St
- 610 W Lincoln St
- 615 W Lincoln St
- 605 W Luverne St
- 720 W Main St
- 105 N Davidson St