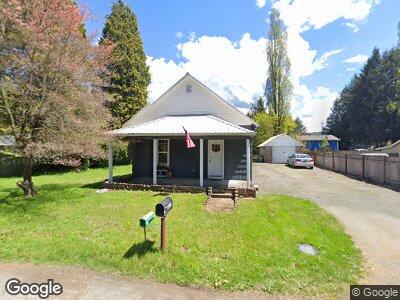
205 N Hubbard Ave Yacolt, WA 98675
Estimated Value: $357,000 - $404,000
2
Beds
1
Bath
864
Sq Ft
$430/Sq Ft
Est. Value
About This Home
This home is located at 205 N Hubbard Ave, Yacolt, WA 98675 and is currently estimated at $371,800, approximately $430 per square foot. 205 N Hubbard Ave is a home located in Clark County with nearby schools including Yacolt Primary School, Amboy Middle School, and Battle Ground High School.
Ownership History
Date
Name
Owned For
Owner Type
Purchase Details
Closed on
Nov 4, 2015
Sold by
The Bank Of New York Mellon
Bought by
Lawffer Noel and Lawffer Mollie
Current Estimated Value
Purchase Details
Closed on
Jul 22, 2015
Sold by
Diefel Pamela R
Bought by
The Bank Of New York Mellon
Purchase Details
Closed on
Nov 19, 2005
Sold by
Diefel Pamela
Bought by
Diefel Pamela R
Home Financials for this Owner
Home Financials are based on the most recent Mortgage that was taken out on this home.
Original Mortgage
$127,200
Interest Rate
6.07%
Mortgage Type
Stand Alone Refi Refinance Of Original Loan
Purchase Details
Closed on
Oct 9, 1998
Sold by
Peterson Betty M and Kuehn Betty M
Bought by
Diefel Pamela
Create a Home Valuation Report for This Property
The Home Valuation Report is an in-depth analysis detailing your home's value as well as a comparison with similar homes in the area
Home Values in the Area
Average Home Value in this Area
Purchase History
| Date | Buyer | Sale Price | Title Company |
|---|---|---|---|
| Lawffer Noel | $94,905 | Chicago Title Insurance | |
| The Bank Of New York Mellon | $105,159 | None Available | |
| Diefel Pamela R | -- | Clark County Title Co | |
| Diefel Pamela | -- | Chicago Title Insurance Co |
Source: Public Records
Mortgage History
| Date | Status | Borrower | Loan Amount |
|---|---|---|---|
| Previous Owner | Diefel Pamela R | $29,906 | |
| Previous Owner | Diefel Pamela R | $28,632 | |
| Previous Owner | Diefel Pamela R | $20,819 | |
| Previous Owner | Diefel Pamela R | $127,200 | |
| Previous Owner | Diefel Pamela R | $111,600 |
Source: Public Records
Tax History Compared to Growth
Tax History
| Year | Tax Paid | Tax Assessment Tax Assessment Total Assessment is a certain percentage of the fair market value that is determined by local assessors to be the total taxable value of land and additions on the property. | Land | Improvement |
|---|---|---|---|---|
| 2025 | $3,089 | $315,822 | $160,094 | $155,728 |
| 2024 | $2,338 | $317,967 | $160,094 | $157,873 |
| 2023 | $2,310 | $307,936 | $130,260 | $177,676 |
| 2022 | $2,484 | $280,543 | $120,120 | $160,423 |
| 2021 | $2,259 | $234,887 | $101,400 | $133,487 |
| 2020 | $2,144 | $218,077 | $95,940 | $122,137 |
| 2019 | $1,781 | $200,601 | $89,700 | $110,901 |
| 2018 | $2,020 | $189,664 | $0 | $0 |
| 2017 | $1,532 | $155,166 | $0 | $0 |
| 2016 | $1,455 | $137,171 | $0 | $0 |
| 2015 | $1,564 | $120,173 | $0 | $0 |
| 2014 | -- | $111,973 | $0 | $0 |
| 2013 | -- | $101,365 | $0 | $0 |
Source: Public Records
Map
Nearby Homes
- 117 E Cushman St
- 205 E Yacolt Rd
- 0 E Yacolt Rd
- 404 E Valley St
- 307 E Valley St
- 506 E Jones St Unit A
- 410 E Heather Way
- 236 W Christy Ct
- 302 E Farrer St
- 250 W Christy Ct
- 255 W Christy Ct
- 404 S Birch Ave
- 642 E Jones St
- 641 E Jones St
- 505 W Humphrey St
- 23810 NE 345th St
- 31101 NE Railroad Ave
- 36520 NE Thompson Rd
- 30313 NE Railroad Ave
- 27602 NE 3 Creek Rd
- 205 N Hubbard Ave
- 203 N Hubbard Ave
- 303 E Yacolt Rd
- 116 E Cushman St
- 301 E Yacolt Rd
- 201 N Hubbard Ave
- 204 N Hubbard Ave
- 109 N Hubbard Ave
- 118 E Cushman St
- 207 E Yacolt Rd
- 205 Louies Ct
- 201 Louies Ct
- 302 E Yacolt Rd
- 114 E Cushman St
- 304 E Yacolt Rd
- 302 N Cedar Ave
- 112 E Cushman St
- 108 N Cedar Ave
- 206 E Yacolt Rd
- 113 E Cushman St