205 N Magnolia Ave Unit A Anaheim, CA 92801
Northwest Anaheim NeighborhoodEstimated Value: $664,000 - $718,000
3
Beds
2
Baths
1,238
Sq Ft
$561/Sq Ft
Est. Value
About This Home
This home is located at 205 N Magnolia Ave Unit A, Anaheim, CA 92801 and is currently estimated at $694,091, approximately $560 per square foot. 205 N Magnolia Ave Unit A is a home located in Orange County with nearby schools including Dr. Peter Marshall Elementary School, Dale Jr High School, and Savanna High School.
Ownership History
Date
Name
Owned For
Owner Type
Purchase Details
Closed on
Apr 8, 2019
Sold by
Tucker Jeffrey A
Bought by
Ybarra Salvador and Barbari Natasha
Current Estimated Value
Home Financials for this Owner
Home Financials are based on the most recent Mortgage that was taken out on this home.
Original Mortgage
$388,000
Outstanding Balance
$340,427
Interest Rate
4.2%
Mortgage Type
New Conventional
Estimated Equity
$353,664
Purchase Details
Closed on
Nov 27, 2017
Sold by
Tucker Jeffrey A and Tucker Sherry J
Bought by
Tucker Jeffrey A and Tucker Sherry J
Purchase Details
Closed on
Jan 11, 2002
Sold by
Tucker Jeffrey A
Bought by
Tucker Jeffrey A and Tucker Sherry J
Home Financials for this Owner
Home Financials are based on the most recent Mortgage that was taken out on this home.
Original Mortgage
$122,000
Interest Rate
7.13%
Purchase Details
Closed on
Feb 16, 1994
Sold by
Tucker Karen L
Bought by
Tucker Jeffrey A
Home Financials for this Owner
Home Financials are based on the most recent Mortgage that was taken out on this home.
Original Mortgage
$124,000
Interest Rate
4.87%
Create a Home Valuation Report for This Property
The Home Valuation Report is an in-depth analysis detailing your home's value as well as a comparison with similar homes in the area
Home Values in the Area
Average Home Value in this Area
Purchase History
| Date | Buyer | Sale Price | Title Company |
|---|---|---|---|
| Ybarra Salvador | $490,000 | Landwood Title Company | |
| Tucker Jeffrey A | -- | None Available | |
| Tucker Jeffrey A | -- | -- | |
| Tucker Jeffrey A | $10,000 | World Title |
Source: Public Records
Mortgage History
| Date | Status | Borrower | Loan Amount |
|---|---|---|---|
| Open | Ybarra Salvador | $388,000 | |
| Previous Owner | Tucker Jeffrey A | $122,000 | |
| Previous Owner | Tucker Jeffrey A | $124,000 |
Source: Public Records
Tax History Compared to Growth
Tax History
| Year | Tax Paid | Tax Assessment Tax Assessment Total Assessment is a certain percentage of the fair market value that is determined by local assessors to be the total taxable value of land and additions on the property. | Land | Improvement |
|---|---|---|---|---|
| 2025 | $6,179 | $546,601 | $425,874 | $120,727 |
| 2024 | $6,179 | $535,884 | $417,524 | $118,360 |
| 2023 | $6,021 | $525,377 | $409,337 | $116,040 |
| 2022 | $5,964 | $515,076 | $401,311 | $113,765 |
| 2021 | $5,894 | $504,977 | $393,442 | $111,535 |
| 2020 | $5,862 | $499,800 | $389,408 | $110,392 |
| 2019 | $2,673 | $219,029 | $90,424 | $128,605 |
| 2018 | $2,640 | $214,735 | $88,651 | $126,084 |
| 2017 | $2,549 | $210,525 | $86,913 | $123,612 |
| 2016 | $2,535 | $206,398 | $85,209 | $121,189 |
| 2015 | $2,511 | $203,298 | $83,929 | $119,369 |
| 2014 | $2,389 | $199,316 | $82,285 | $117,031 |
Source: Public Records
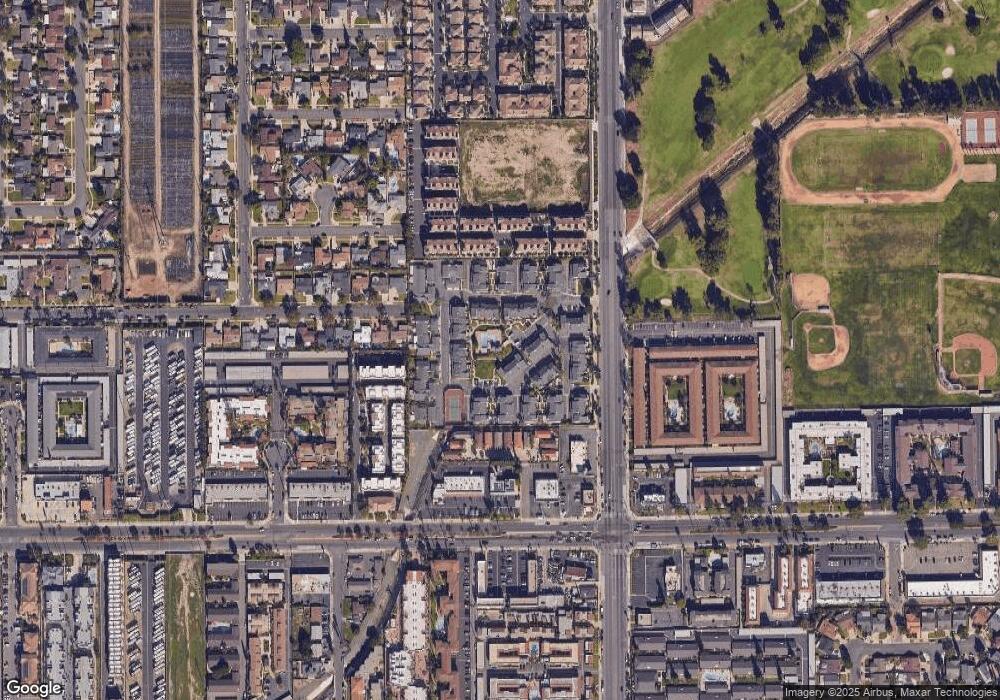
Map
Nearby Homes
- 199 N Magnolia Ave Unit B
- 2709 W Madison Cir
- 400 N Syracuse St
- 2625 W Cameron Ct Unit 121
- 134 S Magnolia Ave Unit 4C
- 605 N La Reina St
- 2770 W Lincoln Ave Unit 29A
- 2770 W Lincoln Ave Unit 40
- 2770 W Lincoln Ave Unit 58
- 2544 W Greenacre Ave
- 2513 W Fulcrum Place
- 525 N Gilbert St Unit 106
- 525 N Gilbert St Unit 151
- 2550 W Rowland Ave
- 2432 W Transit Ave
- 8319 Hickory Dr
- 2871 W Tyler Ave
- 2955 W Lincoln Ave Unit 7
- 2435 W Broadway
- 2943 W Lincoln Ave
- 205 N Magnolia Ave Unit 20 Unit A
- 205 N Magnolia Ave Unit 19
- 207 N Magnolia Ave Unit 17
- 207 N Magnolia Ave Unit 18
- 207 N Magnolia Ave Unit A
- 207 N Magnolia Ave Unit D
- 207 N Magnolia Ave Unit 16
- 207 N Magnolia Ave Unit B
- 203 N Magnolia Ave Unit B
- 203 N Magnolia Ave Unit 24
- 203 N Magnolia Ave Unit 22
- 203 N Magnolia Ave Unit D
- 203 N Magnolia Ave Unit 23
- 199 N Magnolia Ave
- 199 N Magnolia Ave Unit F
- 199 N Magnolia Ave Unit 74
- 199 N Magnolia Ave Unit 78
- 199 N Magnolia Ave Unit D
- 199 N Magnolia Ave Unit A
- 199 N Magnolia Ave Unit C